Microsoft Teams is a powerful communication and collaboration tool that is becoming a major player in the market. Microsoft Teams will replace Skype for Business and StaffHub. Microsoft Teams increases productivity by making all your collaboration– conversations, chats, online meetings, shared files, tasks, and calls available in one single app and one single interface.
In this guide, I will describe how to create a PowerShell Dashboard using the PowerShell Universal Dashboard module created by Adam Driscoll (PowerShell MVP), in order to monitor Microsoft Teams Cloud call queues.
Cloud call queues can provide:
- A greeting message
- Music while people are waiting on hold
- Redirecting calls to call agents
- Setting different parameters such as queue maximum size, timeout, …
If you work with Microsoft Teams Call Queues, you must be able to monitor for example the size of the queue, or how many agents are logged in the queue, …
In this guide, I will not explain what PowerShell UD is, because Adam Driscoll has written extensive documentation already on the topic.
Installing Universal Dashboard
Before going deeper, we need to install the Universal Dashboard module using the following command:
|
1 |
PS > Install-Module UniversalDashboard.Community -AcceptLicense |
In this guide, I installed the community edition which contains a subset of features of the Enterprise Edition. However, you can purchase the Premium Edition in order to enable all the features of Community Edition with added charts, authorization and authentication.
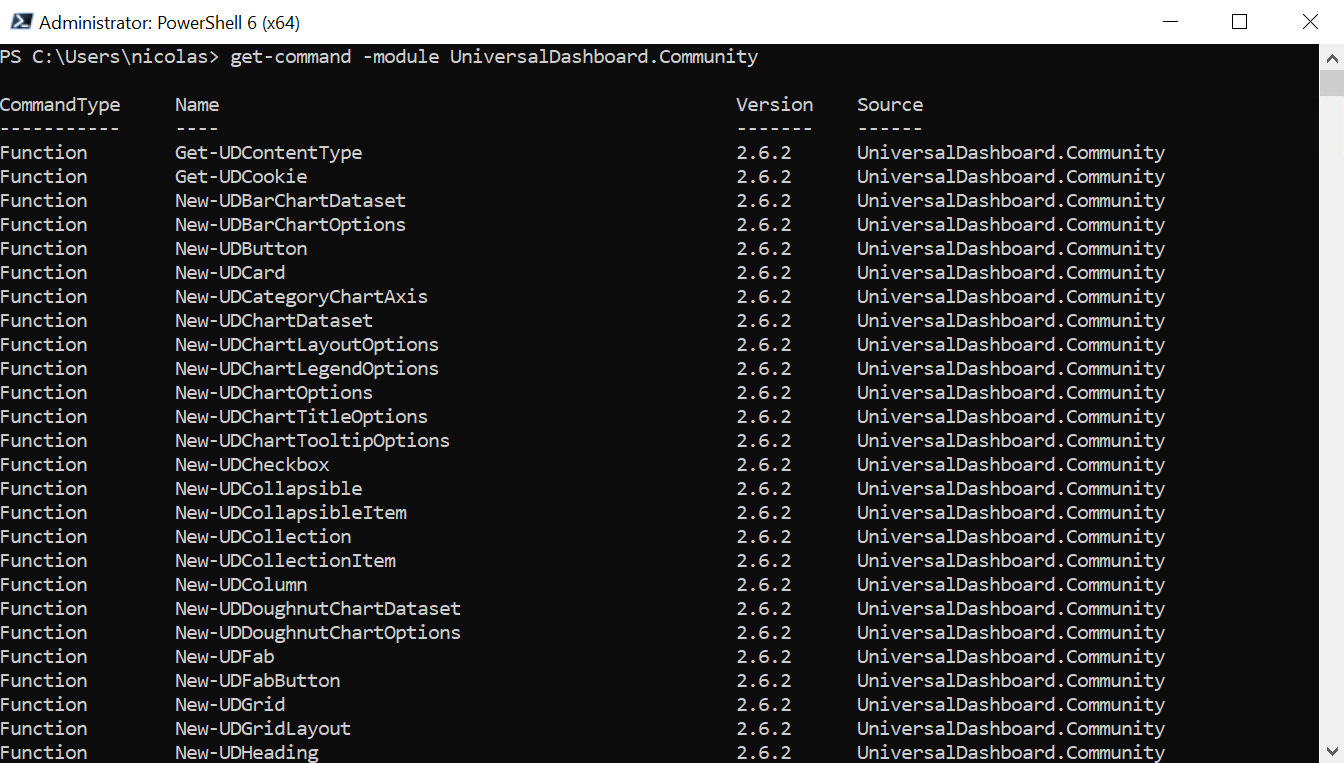
To get a complete list of commands from this module.
|
1 |
PS > Get-command -module UniversalDashboard.Community |
Getting Call Queues Information
Before creating the Dashboard, we need to retrieve the statistics from the Call Queues. First, we need to install the Skype for Business Online Connector module: https://www.microsoft.com/download/details.aspx?id=39366
The Skype module includes the New-CsOnlineSession cmdlet, which enables you to create a remote Windows PowerShell session that connects to Skype for Business Online. Be careful, if you install the Microsoft Teams PowerShell module, you will not be able to work with Teams Cloud Call Queues. The Teams module allows you to create new Teams, add a user, create a Teams channel, …
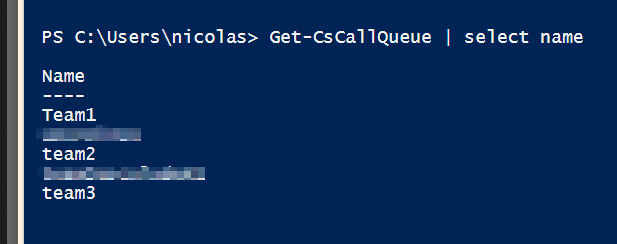
Let’s run the following command to check if Queues are available:
|
1 2 3 4 5 6 7 8 9 10 11 12 13 |
Import-Module "C:\\Program Files\\Common Files\\Skype for Business Online\\Modules\\SkypeOnlineConnector\\SkypeOnlineConnector.psd1" $pw = convertto-securestring -AsPlainText -Force -String 'your_password' $cred = new-object -typename System.Management.Automation.PSCredential -argumentlist "username ",$pw $CSSession = New-CsOnlineSession –Credential $cred Import-PSSession $CSSession –AllowClobber Get-CsCallQueue | select name Remove-PSSession $CSSession |
In my case, I can confirm that 3 Queues are available:
-
-
-
- Team1
- Team2
- Team3
-
-
Now, I can add the following code in order to retrieve statistics from the Queue named “Team1”. This code will create 2 files in the “C:\Dashboard” folder:
-
-
-
- The first file contains the size of the queue
- The second file contains the number of agents in the queue
-
-
|
1 2 3 4 5 6 7 8 9 10 11 12 13 14 15 16 17 18 19 20 21 22 23 |
Import-Module "C:\\Program Files\\Common Files\\Skype for Business Online\\Modules\\SkypeOnlineConnector\\SkypeOnlineConnector.psd1" $pw = convertto-securestring -AsPlainText -Force -String 'your_password' $cred = new-object -typename System.Management.Automation.PSCredential -argumentlist "username ",$pw $CSSession = New-CsOnlineSession –Credential $cred Import-PSSession $CSSession –AllowClobber $size = (Get-CsCallQueue -name Team1).Statistics $fullsuze = $size.StatValue $fullsuze > C:\Dashboard\NBCallRealTime.txt $agent = (Get-CsCallQueue -name Team1).Agents $fullagent = ($agent).count $fullagent > C:\Dashboard\NBAgentRealTime.txt Remove-PSSession $CSSession |

Now, you can create a Scheduled Task in order to run this script every 30 seconds for example.
Creating the PowerShell Script
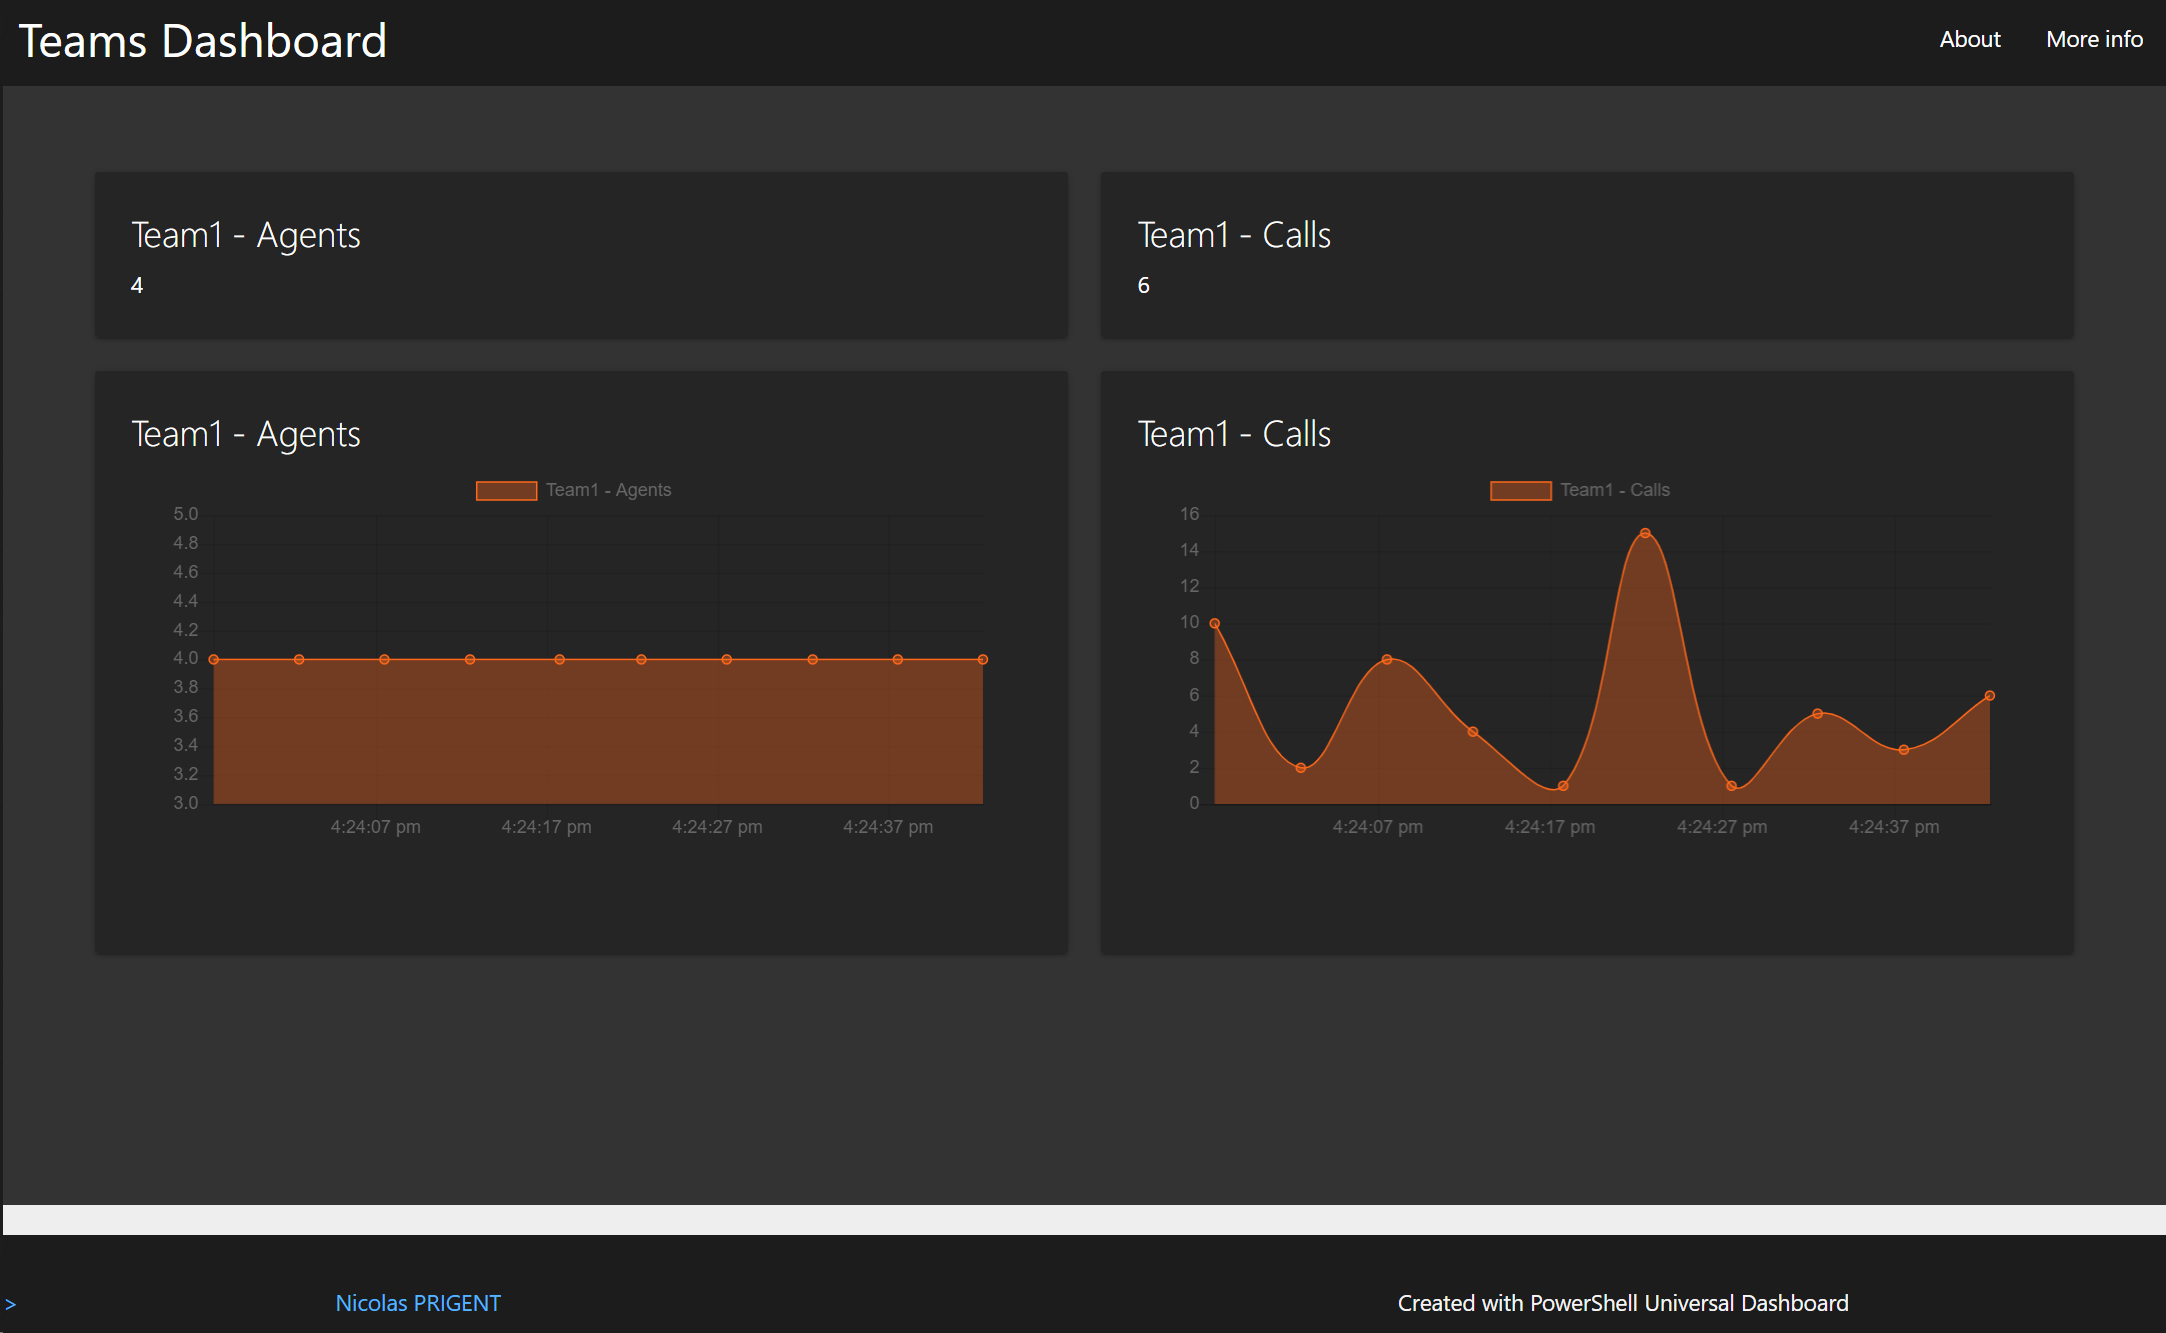
We can now create the script to build the dashboard which will display the following information:
-
-
-
- The agents logged in the queue named “Team1”
- The calls that are waiting in the queue named “Team1”
-
-
Create a file called “Dashboard.ps1” and copy/paste the following code:
|
1 2 3 4 5 6 7 8 9 10 11 12 13 14 15 16 17 18 19 20 21 22 23 24 25 26 27 28 29 30 31 32 33 34 35 36 37 38 39 40 41 42 43 44 45 46 47 48 49 50 51 52 53 54 55 56 57 58 59 60 61 62 63 64 65 66 67 68 69 70 71 72 73 74 75 76 77 78 79 80 81 82 83 84 85 |
#Content dashboard $Footer = New-UDFooter -Copyright 'Nicolas PRIGENT' $NavBarLinks = @((New-UDLink -Text "About" -Url "http://www.google.com" -Icon question_circle), (New-UDLink -Text "More info" -Url "http://www.google.com" -Icon book)) $Monitor = New-UDPage -Name "Team1" -Icon link -Content { New-UDRow -Columns { New-UDColumn -Size 6 -Content { New-UDCounter -Title "Team1 - Agents " -BackgroundColor "#252525" -FontColor "#FFFFFF" -AutoRefresh -RefreshInterval 1 -Endpoint { [int]$NBAgent = (Get-Content -Path C:\Dashboard\NBAgentRealTime.txt -Raw) $NBAgent } } New-UDColumn -Size 6 -Content { New-UDCounter -Title "Team1 - Calls" -BackgroundColor "#252525" -FontColor "#FFFFFF" -AutoRefresh -RefreshInterval 1 -Endpoint { [int]$NBCall = (Get-Content -Path C:\Dashboard\NBCallRealTime.txt -Raw) $NBCall } } New-UDColumn -Size 6 -Content { New-UDMonitor -Title "Team1 - Agents" -Type Line -Endpoint { [int]$NBAgent = (Get-Content -Path C:\Dashboard\NBAgentRealTime.txt -Raw) $NBAgent | Out-UDMonitorData } -ChartBackgroundColor '#59FF681B' -ChartBorderColor '#FFFF681B' -BackgroundColor "#252525" -FontColor "#FFFFFF" } New-UDColumn -Size 6 -Content { New-UDMonitor -Title "Team1 - Calls" -Type Line -Endpoint { [int]$NBCall = (Get-Content -Path C:\Dashboard\NBCallRealTime.txt -Raw) $NBCall | Out-UDMonitorData } -ChartBackgroundColor '#59FF681B' -ChartBorderColor '#FFFF681B' -BackgroundColor "#252525" -FontColor "#FFFFFF" } } New-UDRow -Columns { } } #Create the dashboard Start-UDDashboard -Content { New-UDDashboard -NavbarLinks $NavBarLinks -Title "Teams Dashboard" -NavBarColor '#FF1c1c1c' -NavBarFontColor "#FF55b3ff" -BackgroundColor "#FF333333" -FontColor "#FFFFFFF" -Pages @( $Monitor ) -Footer $Footer } -Port 443 -Name 'ContentDashboard' |
You don’t need to run this script because we will create a Windows Service in order to run the dashboard.
Securing the Dashboard
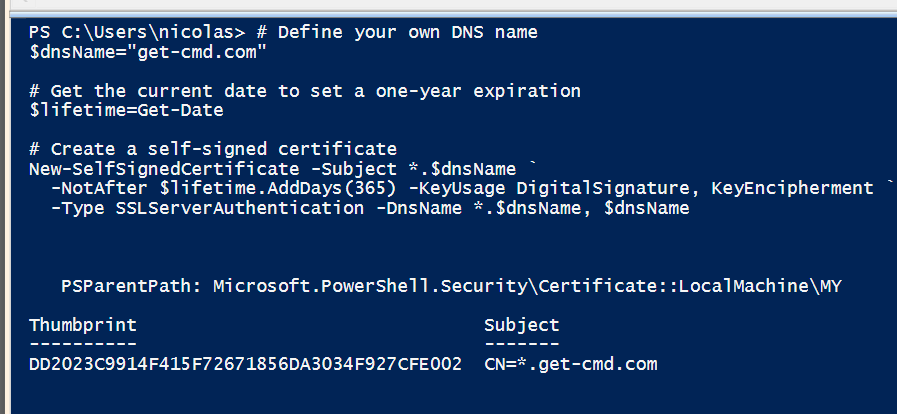
You can secure the dashboard by adding a certificate very easily. In this guide, I created a self-signed certificate using the following script:
|
1 2 3 4 5 6 7 8 9 10 11 12 13 14 15 |
# Define your own DNS name $dnsName="get-cmd.com" # Get the current date to set a one-year expiration $lifetime=Get-Date # Create a self-signed certificate New-SelfSignedCertificate -Subject *.$dnsName ` -NotAfter $lifetime.AddDays(365) -KeyUsage DigitalSignature, KeyEncipherment ` -Type SSLServerAuthentication -DnsName *.$dnsName, $dnsName |
To enable HTTPS, you just need to add the following line:
|
1 |
$cert = ( Get-ChildItem -Path cert:\LocalMachine\My\<replace_with_your_Thumbprint> ) |
Then, simply specify the -Certificate parameter on Start-UDDashboard cmdlet:
|
1 |
-Certificate $cert |
For instance:
|
1 2 3 4 5 6 7 8 9 10 11 |
#Create the dashboard Start-UDDashboard -Content { New-UDDashboard -NavbarLinks $NavBarLinks -Title "Teams Dashboard" -NavBarColor '#FF1c1c1c' -NavBarFontColor "#FF55b3ff" -BackgroundColor "#FF333333" -FontColor "#FFFFFFF" -Pages @( $Monitor ) -Footer $Footer } -Port 443 -Name 'ContentDashboard' -Certificate $cert |
Publishing the dashboard as a Windows Service
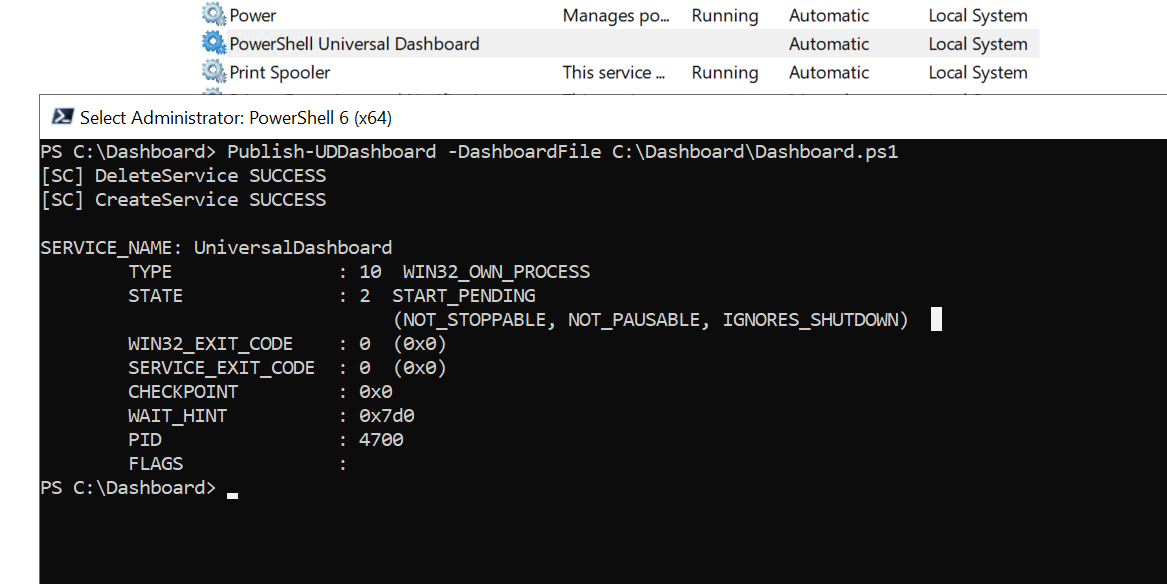
Universal Dashboard can be run as a Windows service. This is accomplished using Publish-UDDashboard cmdlet.
|
1 |
PS > Publish-UDDashboard -DashboardFile ".\dashboard.ps1" |
Please note that DashboardFile must be named “dashboard.ps1”. Once the service is created, you should see the following output:
At this step, the dashboard has been published. We can see the dashboard using the following URL: https://FQDN/Team1
Conclusion
Thanks to PowerShell Universal Dashboard, we can easily monitor any product you want to check. In my case, I built a PowerShell Dashboard to monitor Microsoft Teams very easily, without the expensive cost.
Obviously, you can adjust and customize the dashboard to suit your needs. You can also include other components such as:
-
-
- charts
- counter
- card
- Icons
- …
-
