In part three of this multi-part blog series, we covered how to configure OMS to collect data through integration with System Center Operations Manager (SCOM), and through direct connections to individual servers. We also covered how Microsoft Operations Management Suite uses Solutions to deliver insights into your log data by providing a cost-effective, all-in-one cloud management solution so you can better protect guest workloads in Azure, AWS, Windows Server, Linux, VMWare, and Open Stack.
Introduction
In part three of this multi-part blog series, we covered how to configure OMS to collect data through integration with System Center Operations Manager (SCOM), and through direct connections to individual servers. We also covered how Microsoft Operations Management Suite uses Solutions to deliver insights into your log data by providing a cost-effective, all-in-one cloud management solution so you can better protect guest workloads in Azure, AWS, Windows Server, Linux, VMWare, and Open Stack.
In today’s post, Part 4: we will cover how to perform log analytics with OMS.
In the first section of this post, you will learn how to use the search feature of OMS to perform powerful queries against data being collected by OMS in support of your log analytic efforts for several different OMS Solutions.
In the second section, we will use OMS Search in conjunction with the Security and Audit Solution.
If you want to follow along, please ensure that Part I, Part II and Part III of this multi-part series has been successfully completed.
Infrastructure Overview
We have the following servers installed in our demo environment:
- Domain controller, DNS, WSUS.
- System Center Operations Manager 2012 R2 with update Rollup 9.
- SQL Server holding SCOM databases.
- Linux Server (Ubuntu).
Performing Log Analytics with OMS
Using OMS Search
In this section, we will explore OMS Search capabilities and be introduced to the query syntax.
Step 1 – Examine OMS Search Capabilities and Syntax
In this step, we will explore the basics of the OMS Log Search feature.
- Login to your SQL Server
- Sign in to Operations Management Suite Portal at https://www.microsoft.com/en-us/cloud-platform/operations-management-suite
- In the OMS Portal, On the OMS Overview blade, click Log Search.
- Click the down arrow next to Data based on last 7 days. Note that you can scope searches by 6 hours, 1 day, 7 days or Custom.
- Click OK.
- On the right side of the blade next to SHOW QUERIES, click ON.
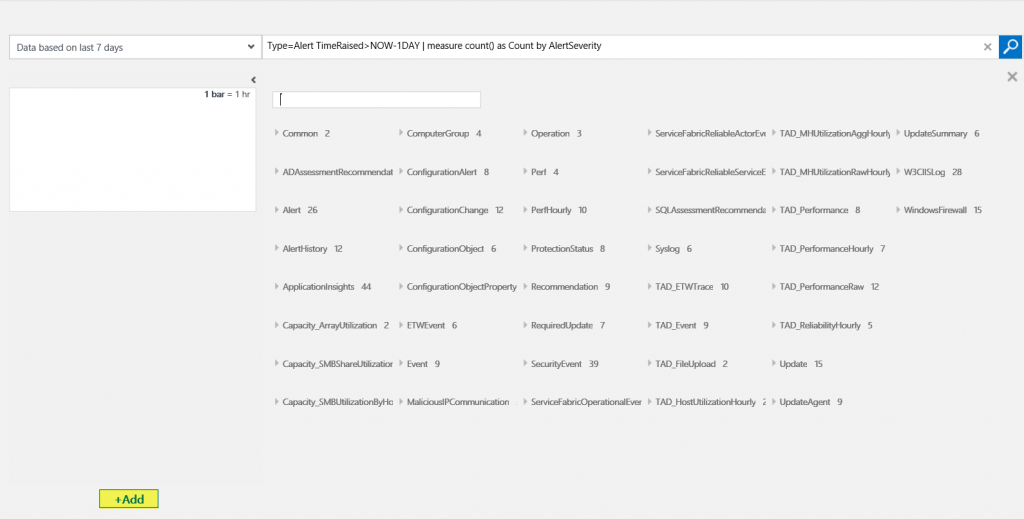
- Under “Saved Searches” locate the Alert Management category and click Alerts raised during the past 1 day grouped by their severity. The left side of the blade is called the Facet Panel. It uses context to pre-populate appropriate areas for further drill-down. This panel contents change based upon the ongoing selections made during drill-down exploration.
- In the diagram at the top of the Facet Panel, hover over a bar. A pop-up will display the time frame under which the associated alerts were gathered.
- Click on a bar to display data based on that custom time range.
- Scroll through the Facet Panel to become familiar with the data being displayed.
- Click +Add.
- Review the items that can be added to the Facet Panel.
- Close the Add
Step 2 – Examine Alert Data
In this step, we will use OMS Search to drill down into data produced by the Alert Management Solution.
- Login to your SQL Server
- Sign in to Operations Management Suite Portal at http://www.microsoft.com/en-us/server-cloud/operations-management-suite/overview.aspx
- In the OMS Portal, Click the Overview
- Click the Alert Management
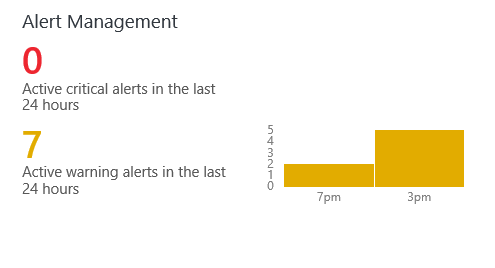
- Under “ACTIVE ALERTS”, under the Active out of xxx Critical Alerts Raised tile, click SEE ALL.
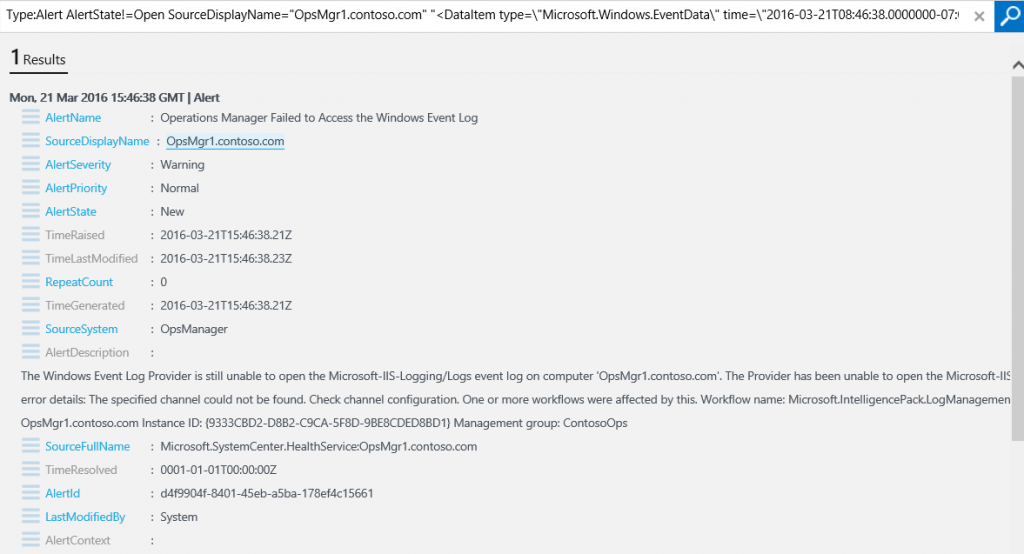
- Note the query string is searching for all alerts where the Alert State is Closed. Edit the query to change the Alert State to Open and click the Search icon as shown in the following screenshot.
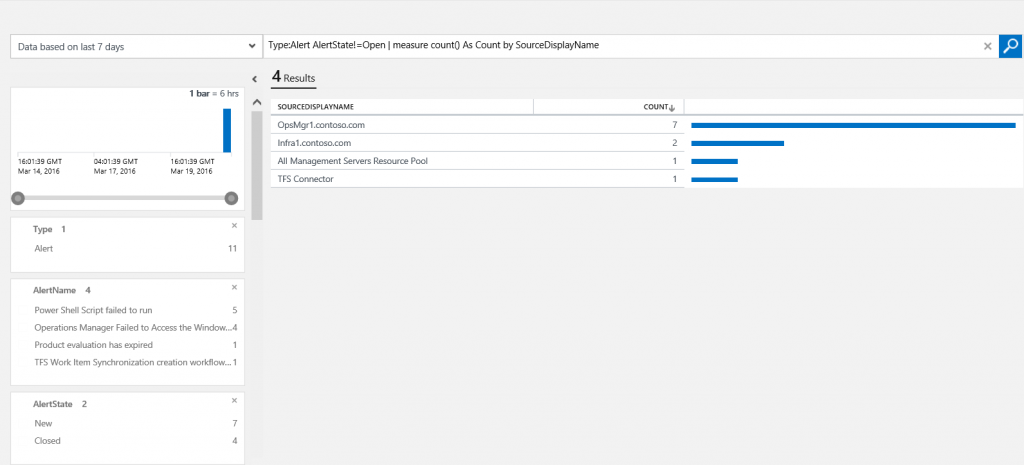
- In the Facet Panel under AlertName, click on the top alert.
- In the result pane, click the top result.
- Under the top alert, click [+] show more.
- Note the various types of data provided. As you can see in the following screenshot, you know the source of the alert, the time it occurred, and other details of the alert. This information can be used as a starting point for troubleshooting.
Step 3 – Examine Malware-Related Data
In this step, we will use OMS Search to drill down into data produced by the Malware Assessment Solution.
- Login to your SQL Server
- Sign in to Operations Management Suite Portal at http://www.microsoft.com/en-us/server-cloud/operations-management-suite/overview.aspx
- In the OMS Portal, Click the Overview
- Click the Malware Assessment
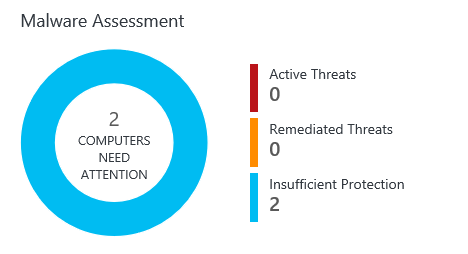
- Under “PROTECTION STATUS”, click No Real Time Protection.
- In the Query field, position the cursor to the right of Measure. Note the associated query is displayed. Measure is one of the most versatile commands in OMS. It allows you to apply statistical functions to your data and aggregate results grouped by a given field.
- Position the cursor at various places in the query string. Note the suggestions that provide additional strings available to add to the preceding portion of the query. This greatly assists in learning the query language.

- At the bottom of the Facet Panel, click +Add.
- Scroll to locate the “ProtectionStatus” fields and click the checkbox next to Management Group Name. On the Facet Panel, note that “ManagementGroupName” has been added as a facet.
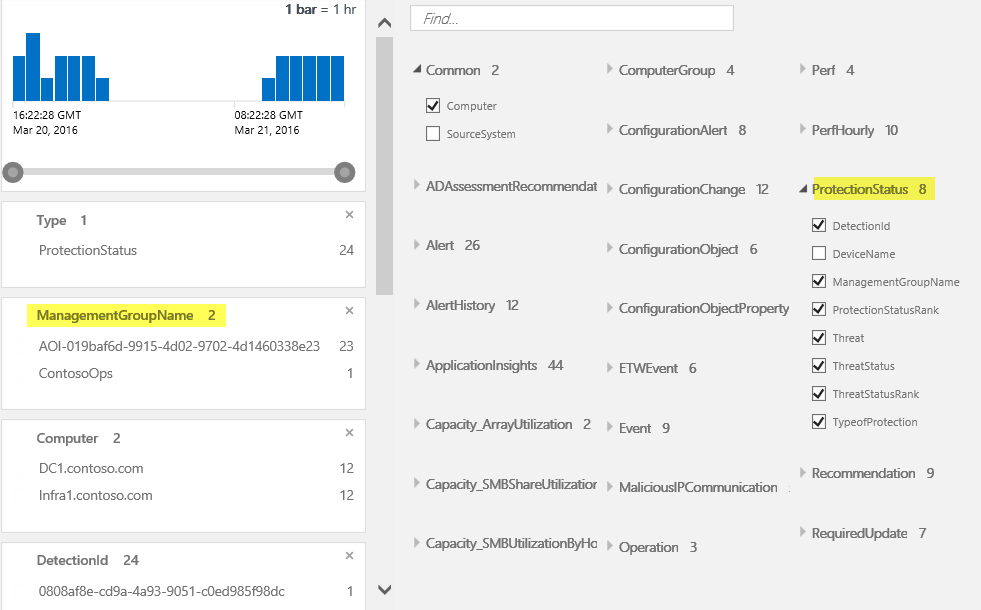
- Edit the query to delete “DeviceName=’DC1.contoso.com’ and click the Search
- Click Save.
- In the name field, type Protection Status by Device.
- In the Category field, type Security and Audit.
- Click Save.
- At the bottom of the page, click HISTORY. On the right side of the Search blade, previous searches are displayed and can be executed again.
- Click Favorites and note that the Saved Searches displays on the right side of the blade.
- In the Saved Searches query box, type Protection Status. Notice your saved search appears in the results.
- Click the Overview
- Click the My Dashboard
- Click Customize.
- Click the Find search box and type Protect.
- Click and drag the Protection Status by Device saved the search to My Dashboard.
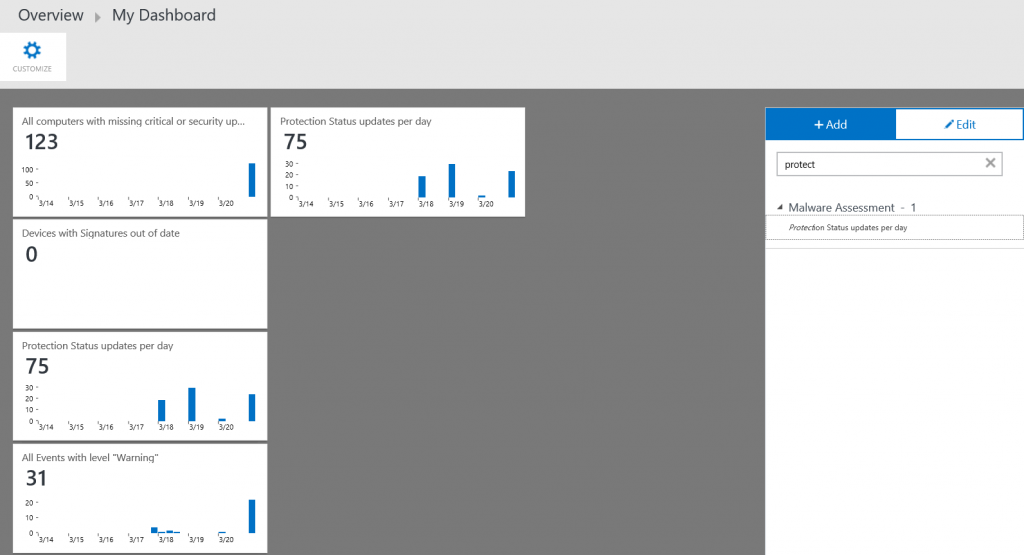
- Click Customize.
Step 4 – Examine Data Related to Software and Service Changes
In this step, we will use OMS Search to drill down into data produced by the Change Tracking solution.
- Login to your SQL Server
- Sign in to Operations Management Suite Portal at http://www.microsoft.com/en-us/server-cloud/operations-management-suite/overview.aspx
- In the OMS Portal, Click the Overview
- Click the Change Tracking
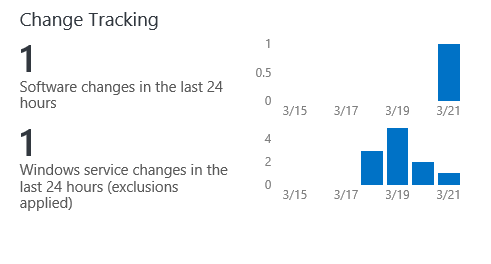
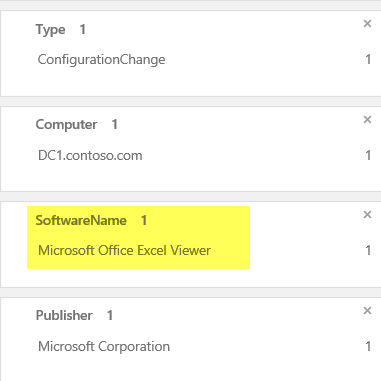
- Under SOFTWARE CHANGES, click contoso.com. The SOFTWARENAME column of the results indicates that Microsoft Office Excel Viewer has been installed on the domain controller, which is a violation of the corporate policy. Knowing this will allow you to remove the application from the domain controller, and take steps to ensure that the policy is known by all IT administrators.
- Click the back arrow in your browser window to return to the Change Tracking solution.
- Under WINDOWS SERVICE CHANGES, click contoso.com.
- Click the SVCDISPLAYNAME column header to sort the field. Note the records that reflect the change you made to the File Replication Service Startup property.
Step 5 – Examine Update Data in OMS
In this step, we will investigate the types of data OS captures with OMS.
- Login to your SQL Server
- Sign in to Operations Management Suite Portal at http://www.microsoft.com/en-us/server-cloud/operations-management-suite/overview.aspx
- In the OMS Portal, Click the Overview
- Click the Log Search
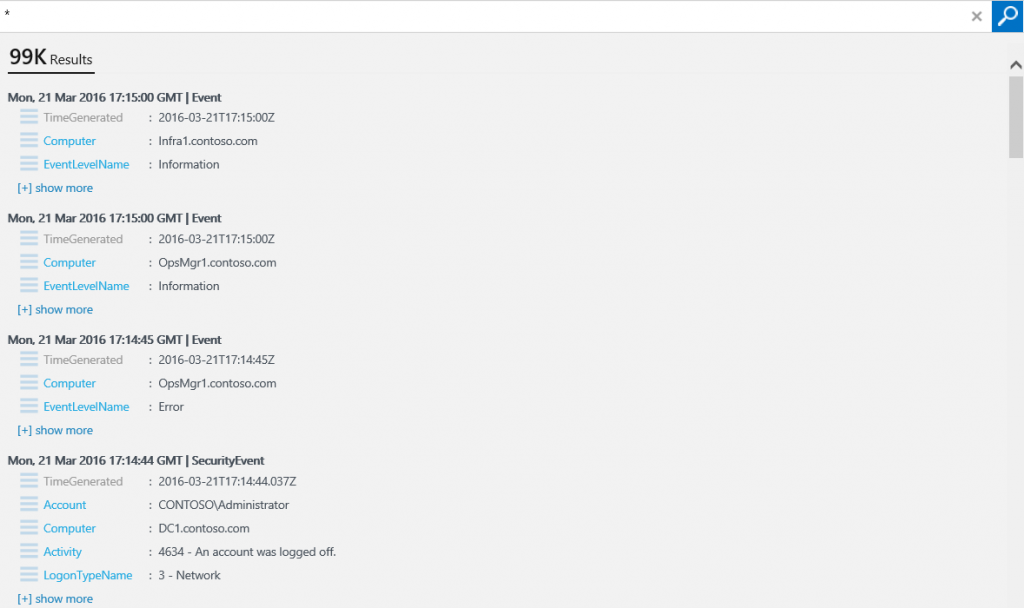
- In the query field, type * and click Search. Note the number of associated logs and number of metrics are presented. At the time of writing this post, we have 99K associated logs.
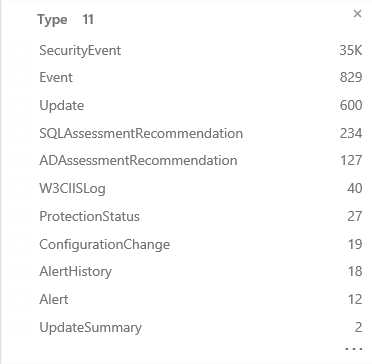
- In the Facet Panel under Type, click UpdateSummary. This will filter the search to only Update-Summary related data.
- To the right of the graph for each solution, click on the [+] plus sign to expand the graph.
- Drill down through the various items to see how they are displayed.
Using the Security and Audit Solution in OMS
In this section, we will explore the Security and Audit Solution in OMS.
Step 1 – Explore Security and Audit Solution Data
In this step, we will explore common queries available through the Security and Audit solution.
- Login to your SQL Server machine.
- Sign in to Operations Management Suite Portal at http://www.microsoft.com/en-us/server-cloud/operations-management-suite/overview.aspx
- In the OMS Portal, Click the Overview icon
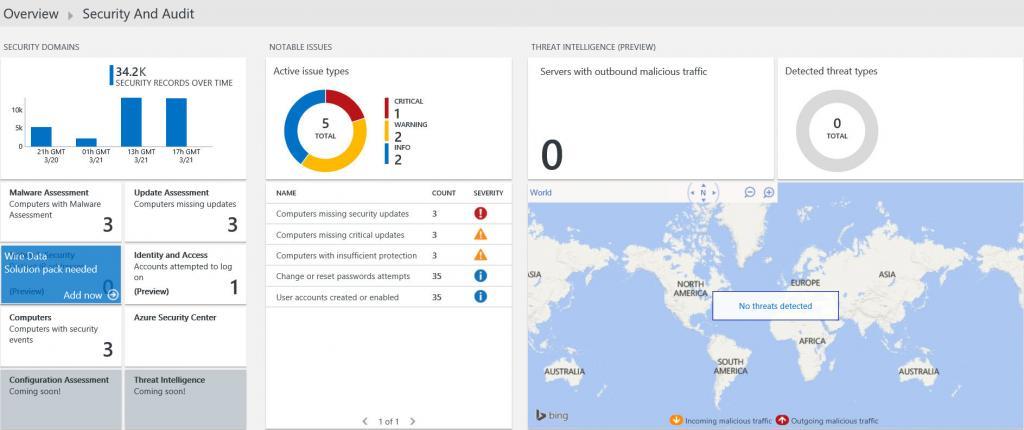
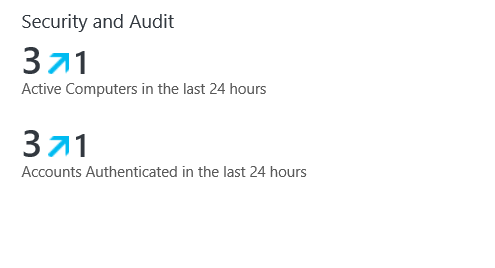
- Click the Security and Audit tile.
- Under “COMMON SECURITY QUERIES”, click Logon Activity by Computer.
- In the Facet Panel, locate the Account facet and note the number of accounts that have logon activity. To display the entire list, click … at the bottom of the facet.
- In the Account facet, click on CONTOSO\DC1$.
- Scroll down to locate the LogonTypeName In a demo environment, you may only see “interactive” logon listed.
- In the results pane, click contoso.com. Each individual logon activity is enumerated with its details.
- To display the entire list of details for an event, click [+] show more. Scroll through the data to become familiar with the type of data provided. In particular, note the Event ID and Event Data, TargetUserName, Process ID, etc.
- Click the back arrow in Internet Explorer to return to the Security and Audit solution.
- On the OMS Security and Audit Solution blade, under “NOTABLE ISSUES”, click Computers missing security updates.
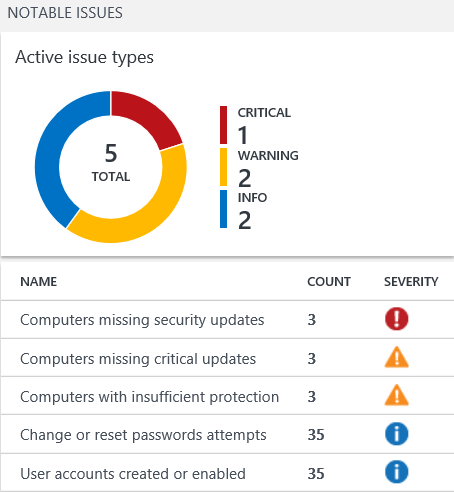
- In the detail pane of Search results, click on contoso.com. Note all missing security updates on DC1.
- Click Save.
- In the Name field, type Missing Updates on DC1.
- In the Category field, type Security and Audit.
- Click Save.
- To export search results, at the bottom of the Search page, click Export.
- Save the .csv file to the desktop as SearchResults.
- On the desktop, right-click SearchResults and click Open with.
- Select ExcelViewer.
- Review the contents and close the viewer.
Step 2 – Use OMS Search to Investigate Suspicious Executables
Please continue to explore the various types of data provided by OMS.
In the Security and Audit solution, under NOTABLE ISSUES, you can check Suspicious Executables.
Search displays detailed information about the process, including the computers where the process ran, the user account that the process ran under, the date and time that an event was created for the process, and the name of the process. You can see which user has executed a Command Prompt on the domain controller which would not be unusual for an administrator. However, the file has been reported as being suspicious because the file has been edited resulting in a change in the file hash.
Using the information that you find, you can take corrective action as needed. For example, if you determine that the executable is malware then you’ll want to take action to remove it from all the computer systems that it affects. After the executable is removed and OMS receives updated log and audit events for your computer systems, values on the NOTABLE ISSUES blade will change on the following day.
Conclusion
Congratulations! In Part 4 we covered how to use the search feature of OMS to perform powerful queries against data being collected by OMS in support of your log analytic efforts for several different OMS Solutions, we discussed how to use OMS Search in conjunction with the Security and Audit Solution to identify any suspicious activity that might occur in your environment.
As we explored in this series of posts, Microsoft Operations Management Suite (OMS) is a Microsoft cloud-based IT management solution that helps you manage and protect your on-premise and cloud infrastructure. Since OMS is implemented as a cloud service, you can have it up and running quickly with minimal investment in infrastructure services. New features are delivered automatically, saving you a lot of ongoing maintenance and upgrade costs.
In addition to providing valuable services on its own, OMS can integrate with System Center components to extend your existing management investments into the cloud. System Center and OMS can work together to provide a full hybrid management experience.
I hope this series of blog posts was informative for you and I would like to thank you for reading!
