Microsoft has just released to the public, and with a stable version (preview was announced in September 2016), Azure Monitor. This platform represents a set of features and capabilities within Azure to provide detail logs, metrics and diagnostic about the workloads in the Microsoft public cloud.
For those that were only using the preview version of Azure Monitor, this new release includes a couple of new features: Reusable “Action Groups” for managing lists of alert “receivers” and Activity Log Alerts. With these features, Azure Monitor provides the ability to have your operations team receive an SMS when events such as an Azure service health incident, a deployment failure, or an autoscale event occur.
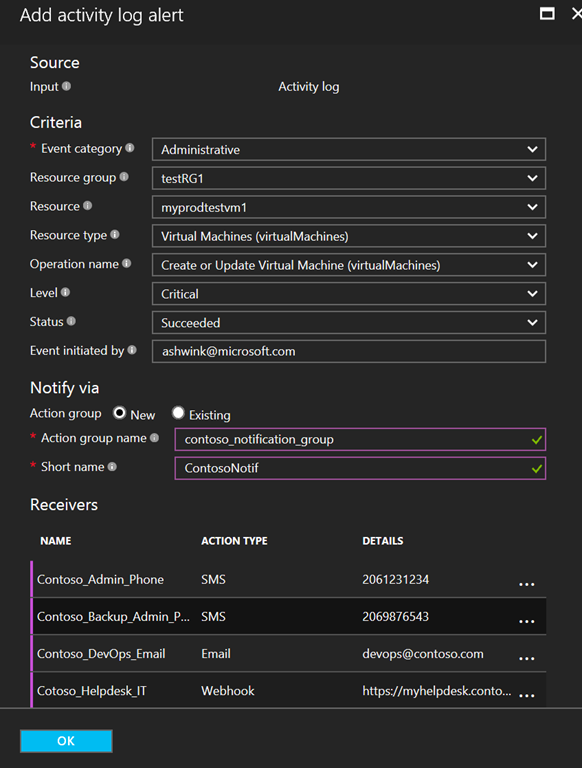
Here’s an example of configuring activities and the “receivers” for alerts. In this case, we can see how with a specific alert we can set notifications via SMS, email and a webhook (also called web callback, basically is an HTTP action):
Monitoring Capabilities in Azure Monitor
This cloud platform offered by Microsoft includes most of the basic monitoring components necessary for any infrastructure, here’s a summary:
- Activities Logs: Keeps track of all the operations performed on your Azure resources. You can use the Activity Log section in the portal to quickly search and identify operations that may impact your application. This component also integrates with Log Analytics, part of the Microsoft Operations Management Suite (OMS).
- Metrics: You can browse all the available metrics for any resource and plot them on charts. When you find a metric that you are interested in, and you can create a rule in just one click. The metrics can also be accessed by a REST API, therefore can be consumed and used by 3rd party monitoring tools.
- Diagnostic logs: Contain rich information about operations and errors that are important for auditing as well as troubleshooting purposes.
All of these monitoring capabilities come with the possibility of automated actions. For every alert triggered you can set an automated action to fix an issue presented by an Azure Monitor alert.
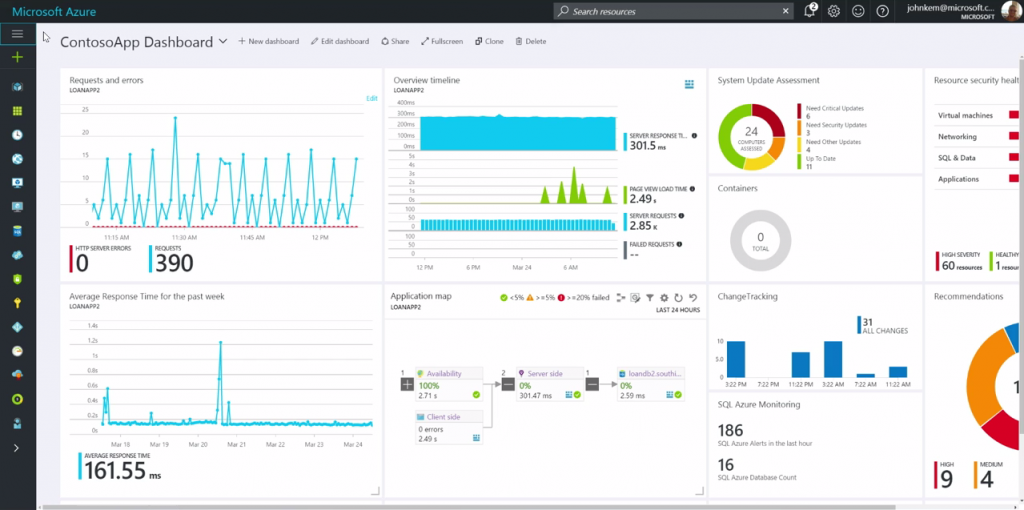
In addition to trigger actions when an event occurs, there are several ways to use that information: Visualizing in dashboards (as the image shows at the start of this article); archive the information for in historical data and/or audits; query the information using REST APIs, CLI or PowerShell; or route to a notification service.
The following is a diagram of Azure Monitor capabilities and the options available to use that information:
Azure Monitor Pricing
The pricing for this platform is based on usage, and it will depend mainly on metric queries and the notifications we set in the environment. Here’s a summary:
Microsoft is finding the pay-as-you-go model to apply pretty much in any scenario, and even though Operations Management System (OMS) offers similar capabilities in a cloud scenario, Azure Monitor focus on a true model for paying only for what’s being use. OMS model is still based on a pricing per-node.


