INTRODUCTION
Since I’m done with measuring SQL Server Availability Groups (AG) on Storage Spaces and SQL Server Failover Cluster Instances (FCI) on Storage Spaces Direct (S2D) performance, I can write the most interesting part in this series: performance comparison.
TOOLKITS USED
Before I move to the comparison part, I want you to take a look at the schemes of setups that were used in two previous parts. Note that each setup has 8 drives in the underlying storage because S2D needs 4+ drives in each host to be deployed (https://docs.microsoft.com/en-us/windows-server/storage/storage-spaces/storage-spaces-direct-hardware-requirements#minimum-number-of-drives-excludes-boot-drive).
Below, find more details about the cluster used for testing SQL Server FCI performance.
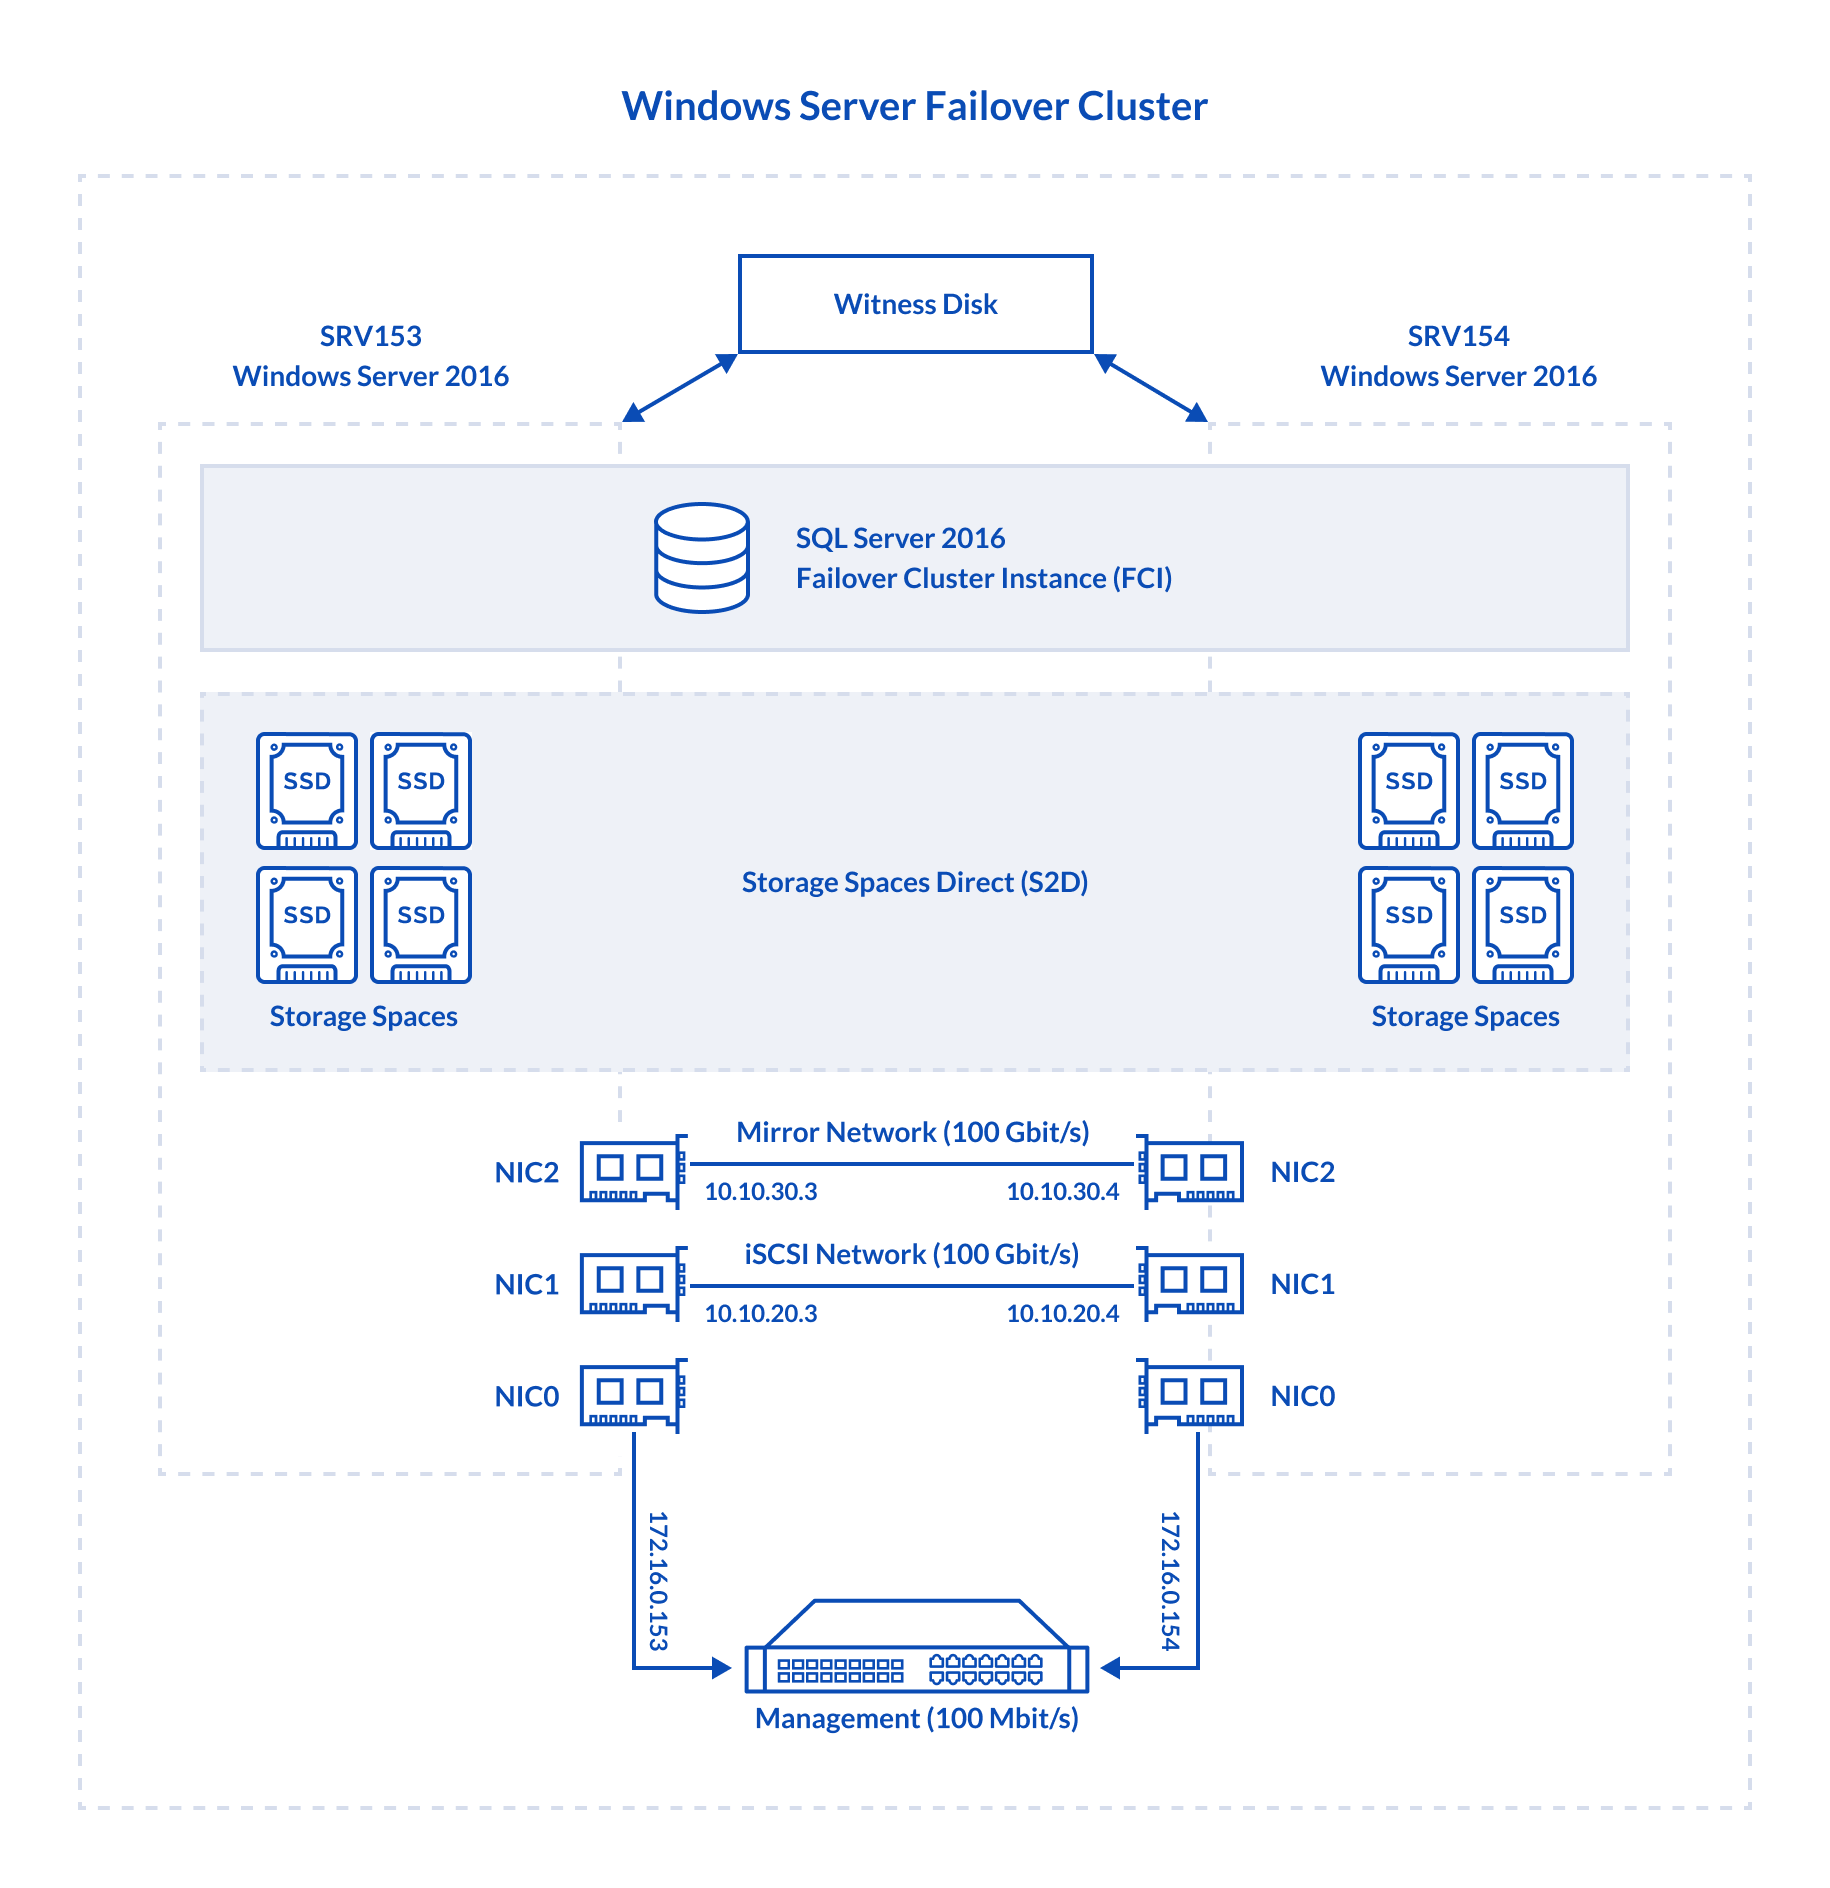
- SRV153, SRV154 both host are identical
- Dell R730, CPU 2x Intel Xeon E5-2697 v3 @ 2.60 GHz, RAM 128GB
- Storage: 4x Intel SSD DC S3500 480GB
- LAN: 1x Broadcom NetXtreme Gigabit Ethernet, 2x Mellanox ConnectX-4 100Gbit/s
- OS: Windows Server 2016 Datacenter
- Database Management System: Microsoft SQL Server 2016
Here are more details about the environment built for measuring SQL Server AG performance
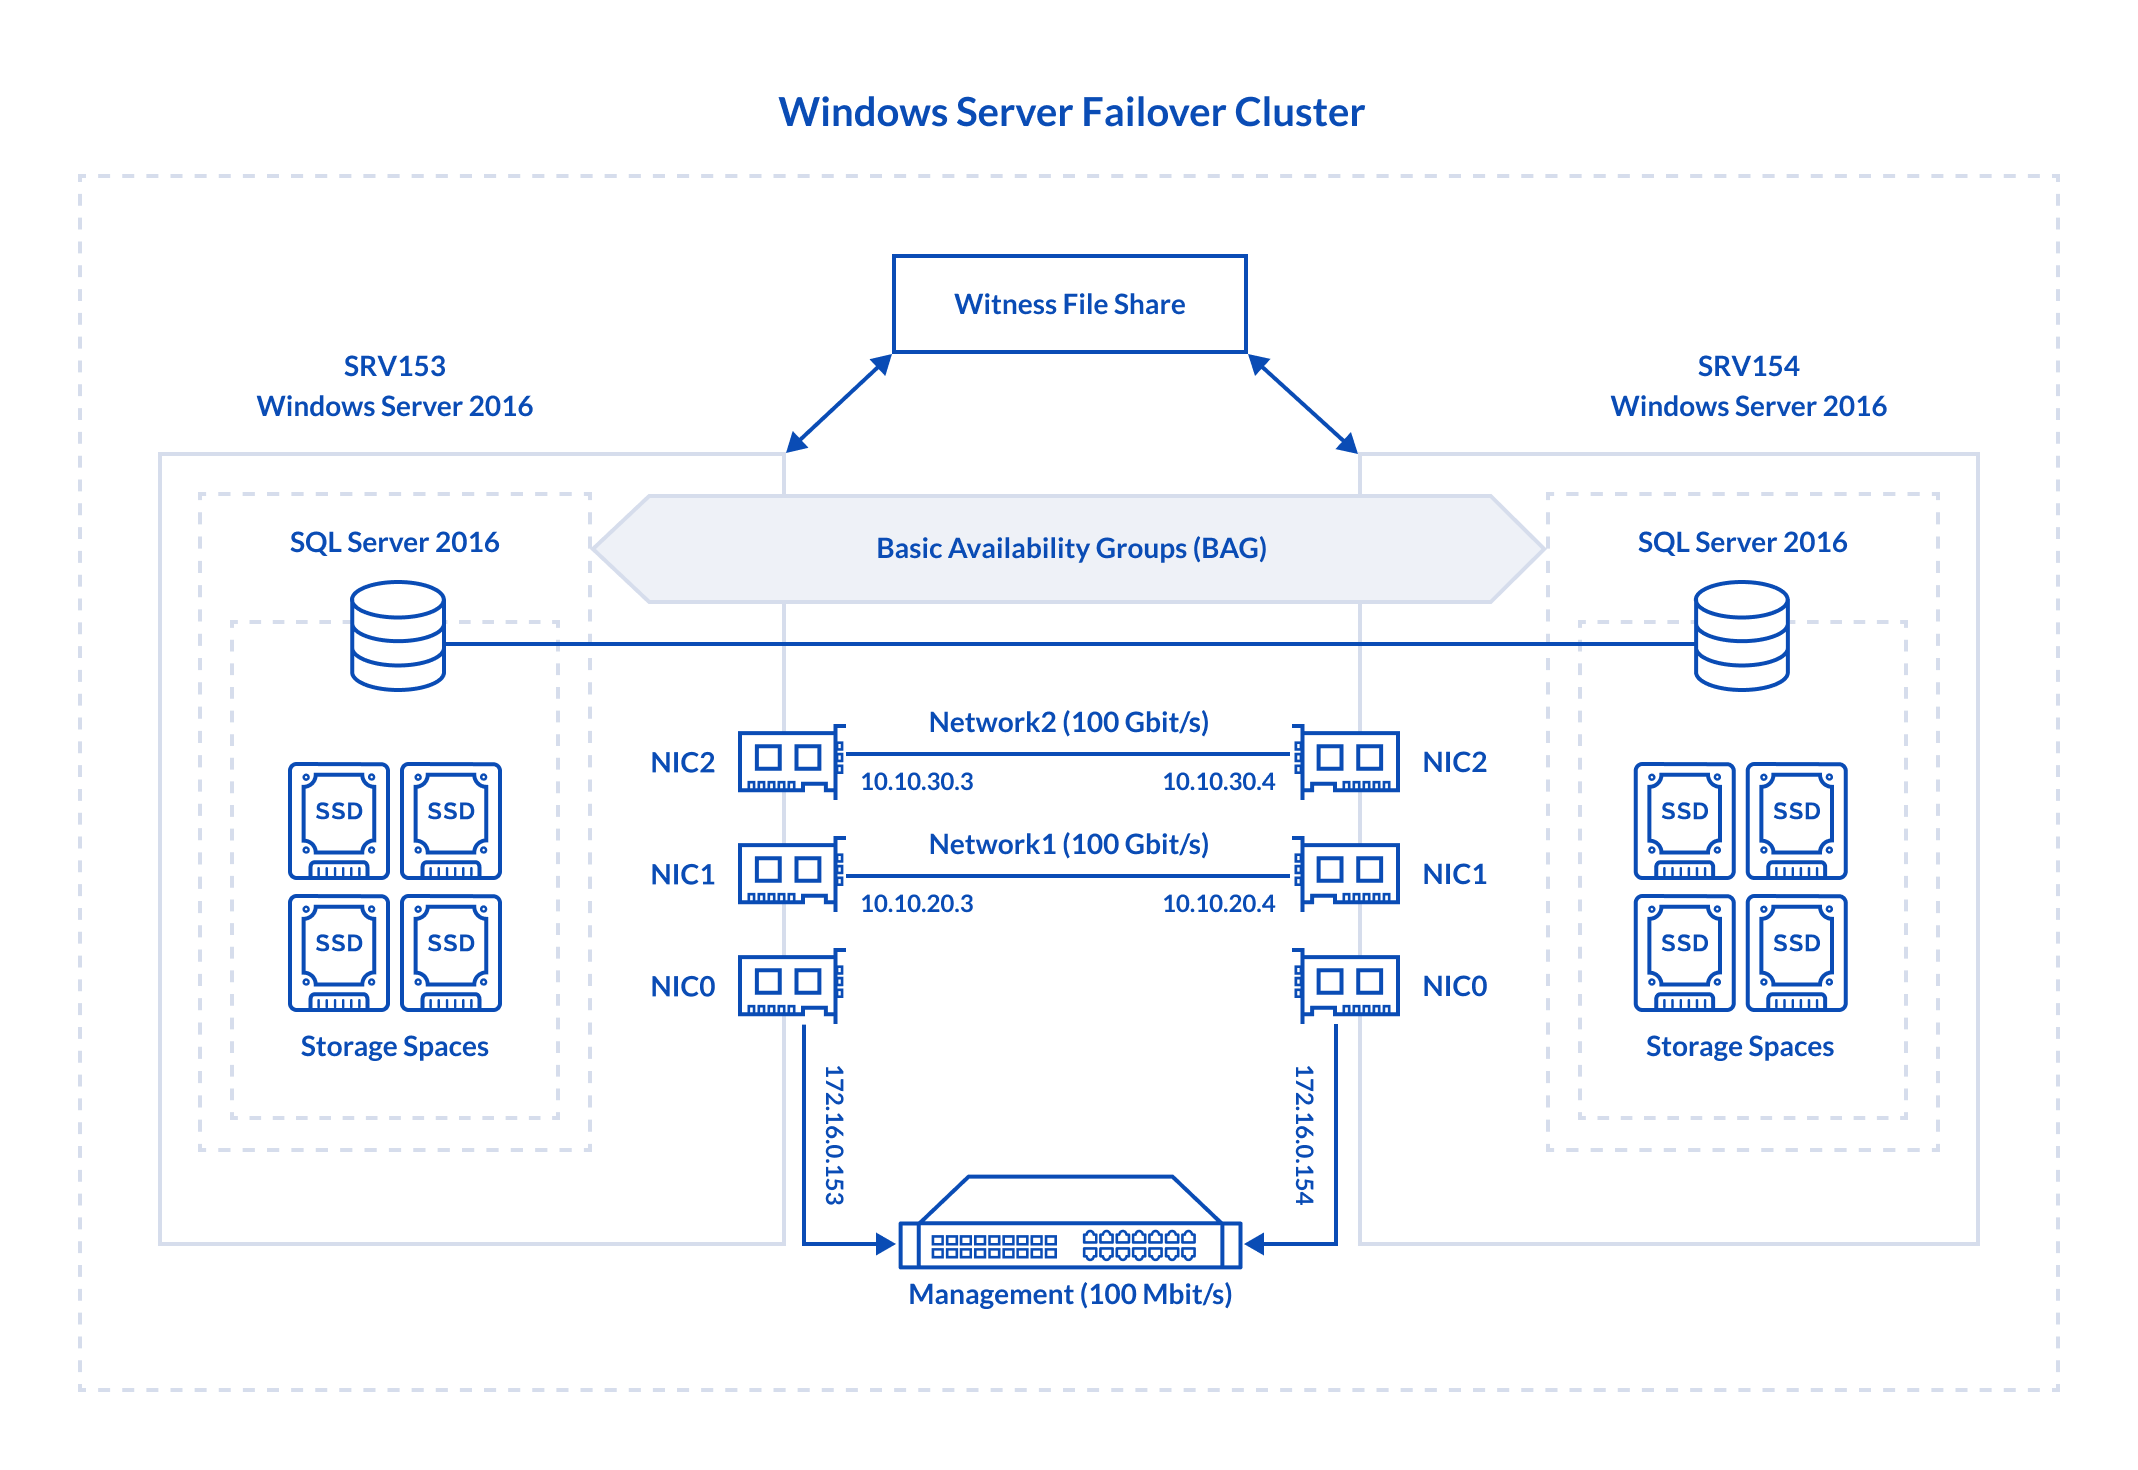
- SRV153, SRV154
- Dell R730, CPU 2x Intel Xeon E5-2697 v3 @ 2.60 GHz, RAM 128GB
- Storage: 4x Intel SSD DC S3500 480GB
- LAN: 1x Broadcom NetXtreme Gigabit Ethernet, 2x Mellanox ConnectX-4 100Gbit/s
- OS: Windows Server 2016 Datacenter
- Database Management System: Microsoft SQL Server 2016
LET’S JUMP TO COMPARISON!
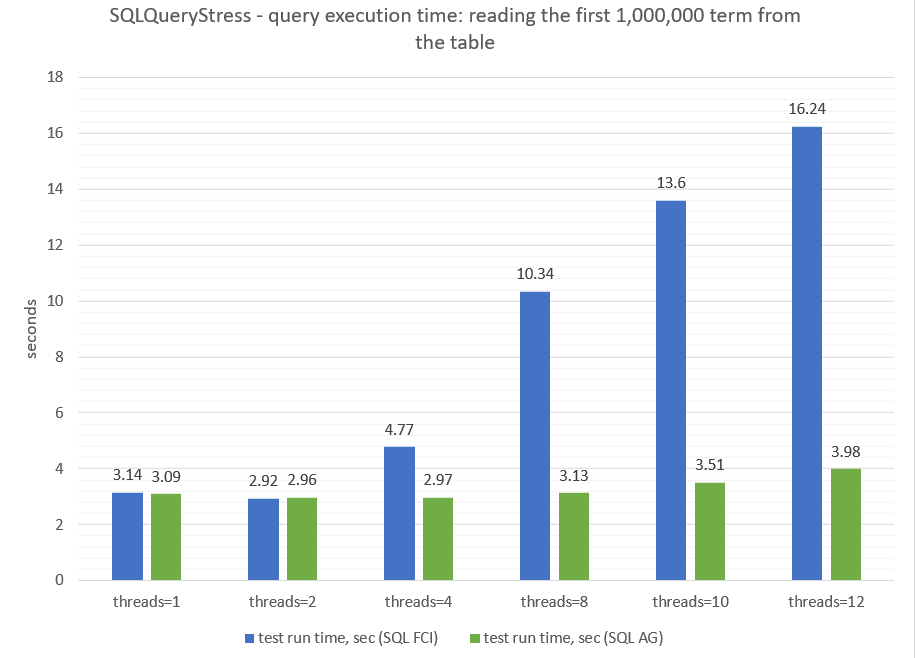
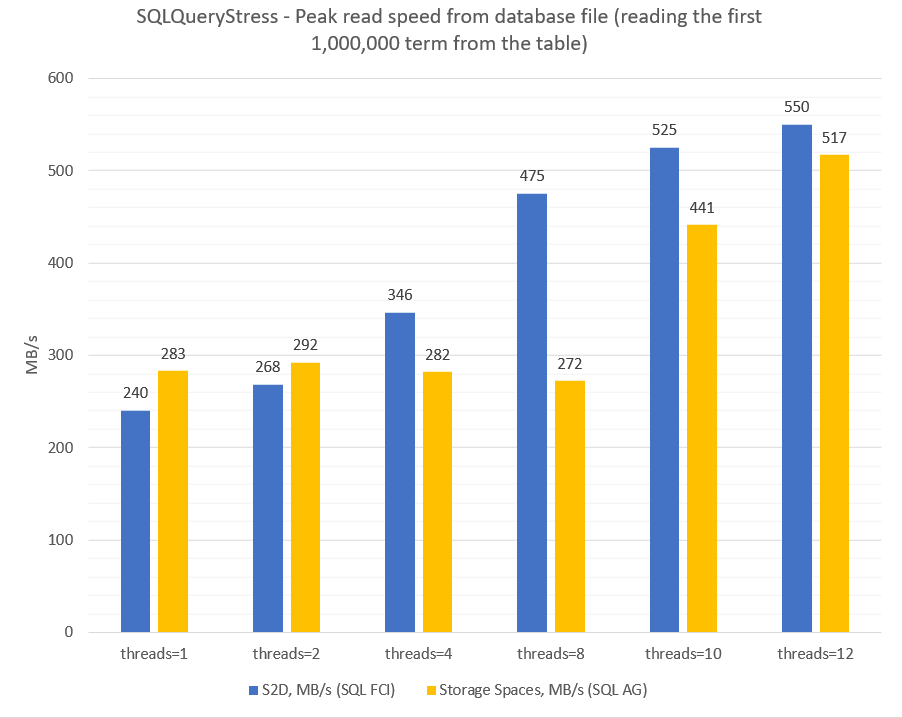
First, let’s see how reading performance of both solutions changes under the varying number of threads. I used SQLQueryStress here to see how fast both solutions can read 1M lines from the database.
| SQL FCI | SQL AG | |||
|---|---|---|---|---|
| test run time. sec | S2D.
MB/ |
test run time. sec | Storage Spaces. MB/s | |
| threads=1 | 3.14 | 240 | 3.09 | 283 |
| threads=2 | 2.92 | 268 | 2.96 | 292 |
| threads=4 | 4.77 | 346 | 2.97 | 282 |
| threads=8 | 10.34 | 475 | 3.13 | 272 |
| threads=10 | 13.6 | 525 | 3.51 | 441 |
| threads=12 | 16.24 | 550 | 3.98 | 517 |
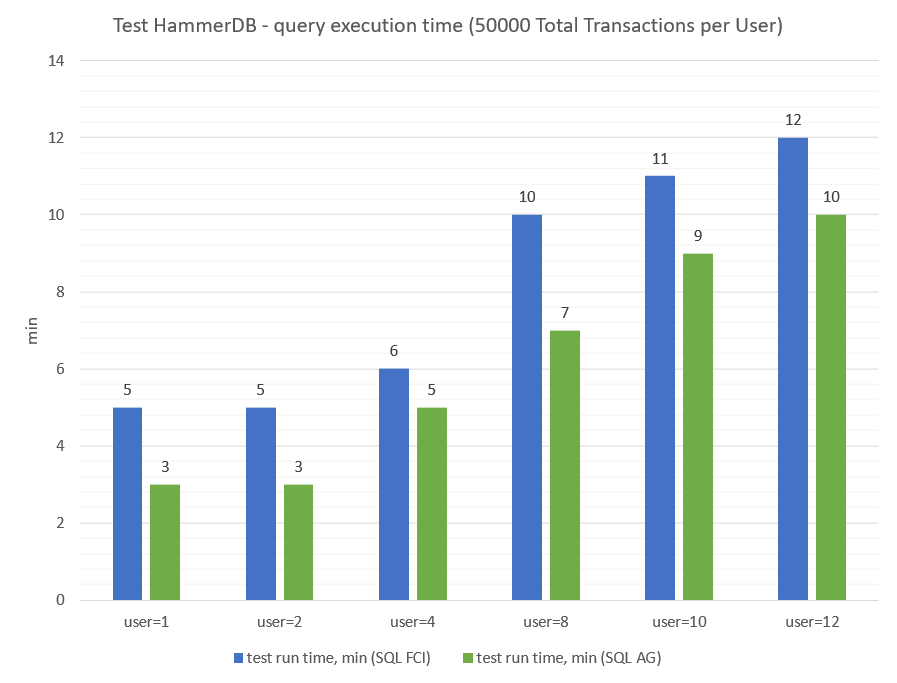
Now, let’s take a closer look at writing performance under the varying number of threads (Virtual Users). I measured it here for both solutions with HammerDB (Total Transactions per User = 50 000).
| Test HammerDB (50000 Total Transactions per User) | ||
|---|---|---|
| SQL FCI
test run time, min |
SQL AG
test run time, min |
|
| Virtual User=1 | 5 | 3 |
| Virtual User=2 | 5 | 3 |
| Virtual User=4 | 6 | 5 |
| Virtual User=8 | 10 | 7 |
| Virtual User=10 | 11 | 9 |
| Virtual User=12 | 12 | 10 |
CONCLUSION
Both solutions finished reading 1M lines from the database in 19 seconds regardless of storage configurations. Ok, that’s weird; let’s take a closer look at the performance measured with SQLQueryStress and HammerDB.
Results obtained with SQLQueryStress clearly shows that there’s a huge reading performance gap between SQL Server AG and SQL Server FCI. The former completes the reading request in 3.98 seconds, while SQL Server FCI needs around 16.24 seconds to finish it. Nevertheless, SQL Server on S2D has higher reading performance than one run on Storage Spaces (plots clearly show that).
Numbers derived with HammerDB say that it takes longer for SQL Server FCI to finish writing tests.
Why is SQL Server FCI that slow? I think it may be happening due to the resiliency type. While creating a virtual disk on S2D, I have selected Mirror for the resiliency type. For the PhysicalDiskRedundancy parameter, I have set 1 (Type – Two-way-mirror). Wait, but… I have configured everything just as Microsoft recommends (https://docs.microsoft.com/en-us/windows-server/storage/storage-spaces/plan-volumes)!

