INTRODUCTION
Some time ago, while looking through what SQL server Basic Availability Groups (BAG) can do, I found an awesome article by Pieter Vanhove: https://blogs.technet.microsoft.com/msftpietervanhove/2017/03/14/top-5-questions-about-basic-availability-groups/. There was nothing about performance, though, so I thought: “Hey, why not write an article about BAG performance?” Later, I realized that you need to compare this performance to something else, right? So, I decided to add SQL Server Failover Cluster Instance (FCI) performance measurements. Maybe, I’ll add some SQL Server Availability Groups (AG) measurements at the end; but, let’s see first whether SQL Server FCI can run twice as fast as SQL Server BAG.
In this study, I measured BAG performance alone. Now, as we know the scope of the article, let’s move on!
THE TOOLKIT USED
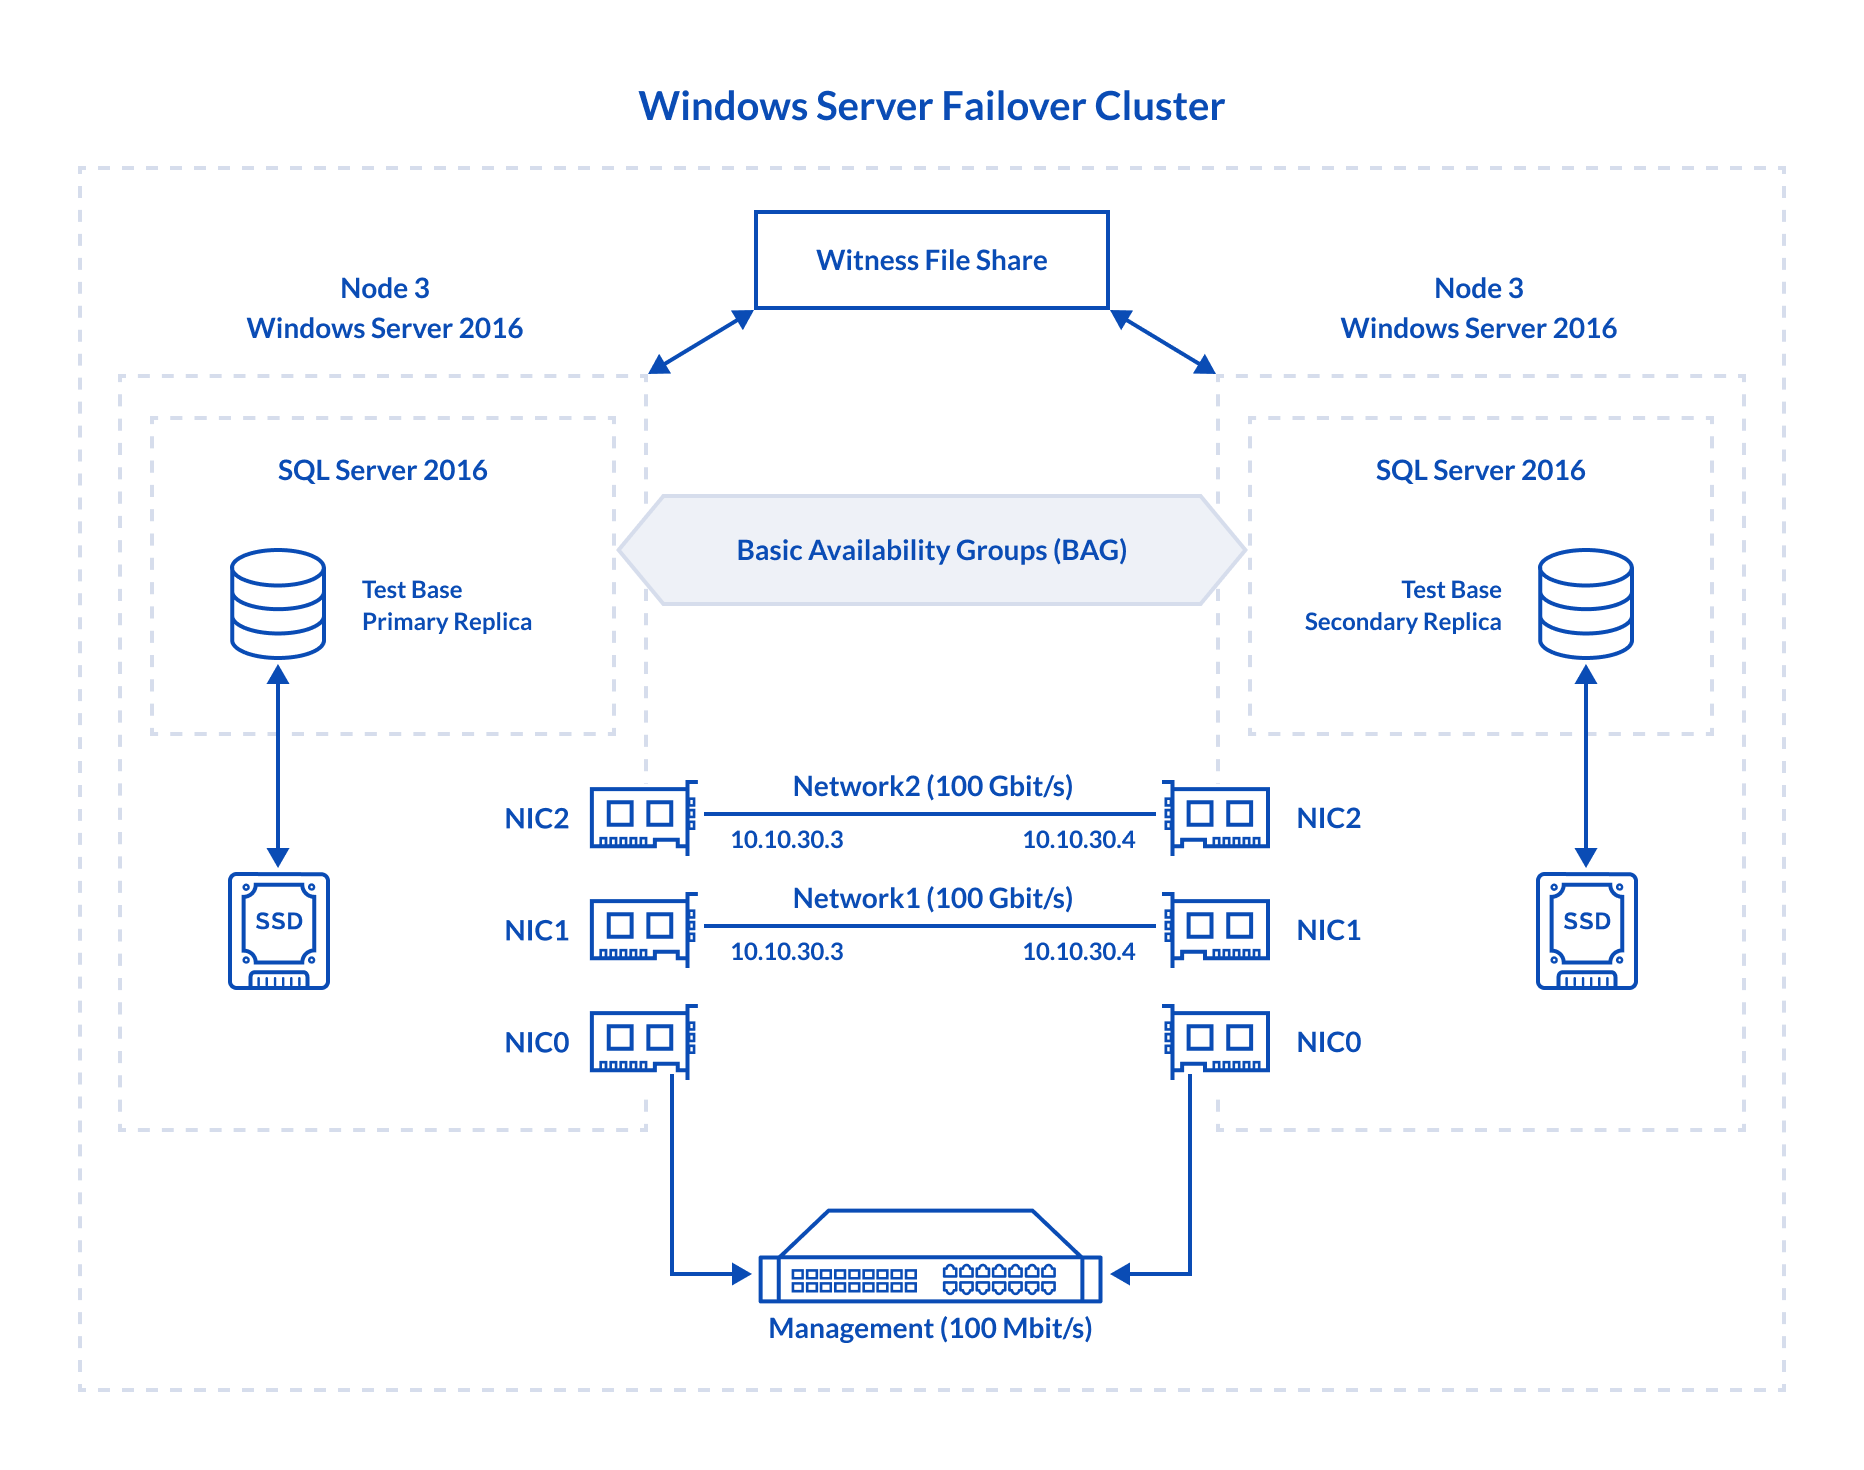
First, let’s talk about the setups used for this study.
Here are more details on the setup configuration:
Node 3, Node 4: Both are identical from the hardware point of view
Dell R730, CPU 2x Intel Xeon E5-2697 v3 @ 2.60 GHz, RAM 128GB
Storage: 1x Intel SSD DC S3500 480GB (You need fast underlying storage for your database, right? )
LAN: 1x Broadcom NetXtreme Gigabit Ethernet, 2x Mellanox ConnectX-4 100Gbit/s
OS: Windows Server 2016 Datacenter
Database Management System: Microsoft SQL Server 2016
HOW I TEST SQL SERVER BASIC AVAILABILITY GROUPS (BAG)
Deploy 2-node SQL Server BAG with an empty database
Install Windows Failover Cluster. I assigned quorum vote to the separate Share Witness.
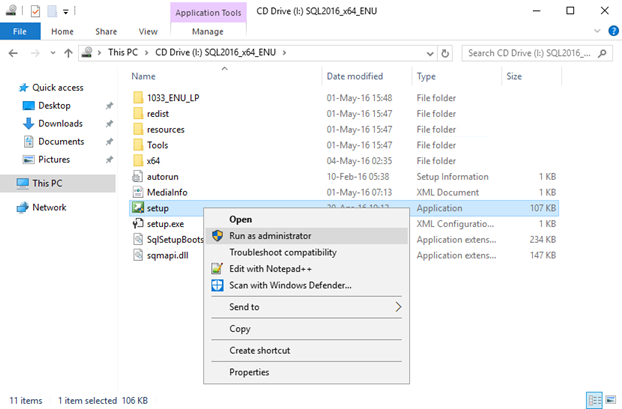
Afterward, install SQL Server 2016 on Node 3 from the preinstalled image. Just run it as administrator to start the installation process.
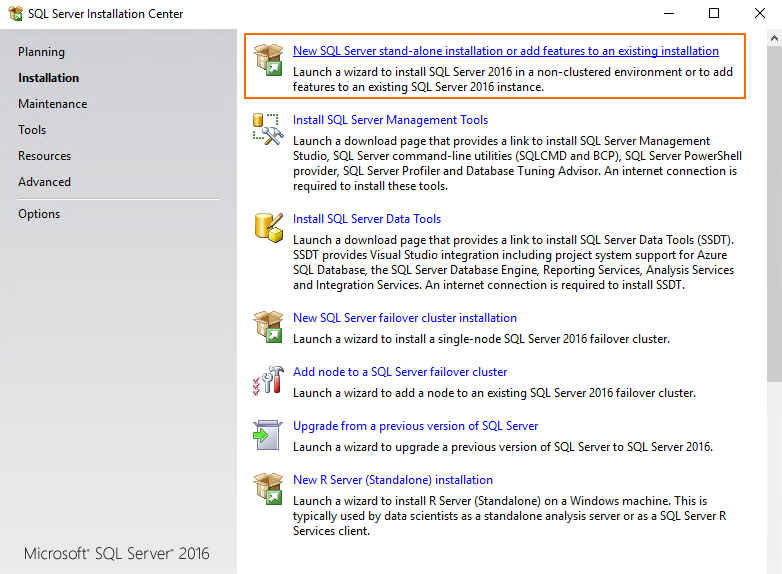
During installation, select the New SQL Server stand-alone installation or add features to an existing installation option.
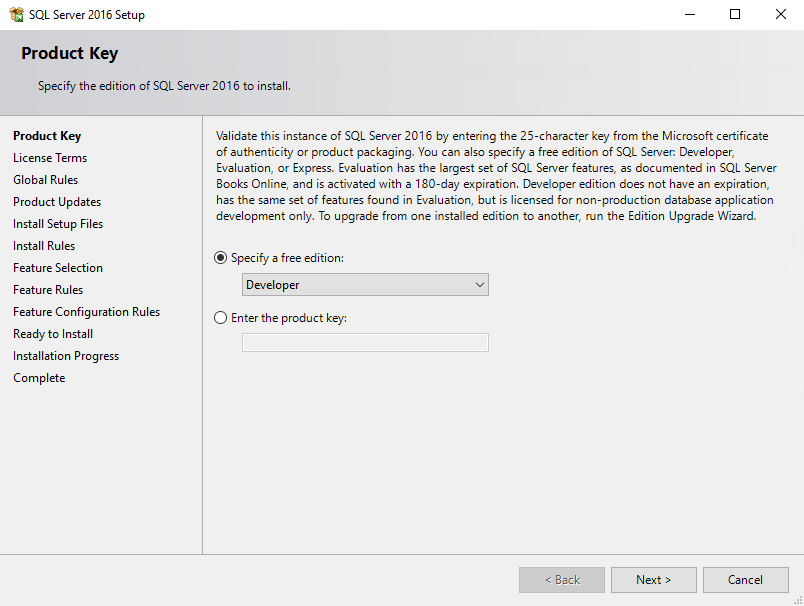
Next, once prompted to specify the edition, select Developer from the Specify a free edition dropdown list. It is free, and I think that it is enough for today’s study.
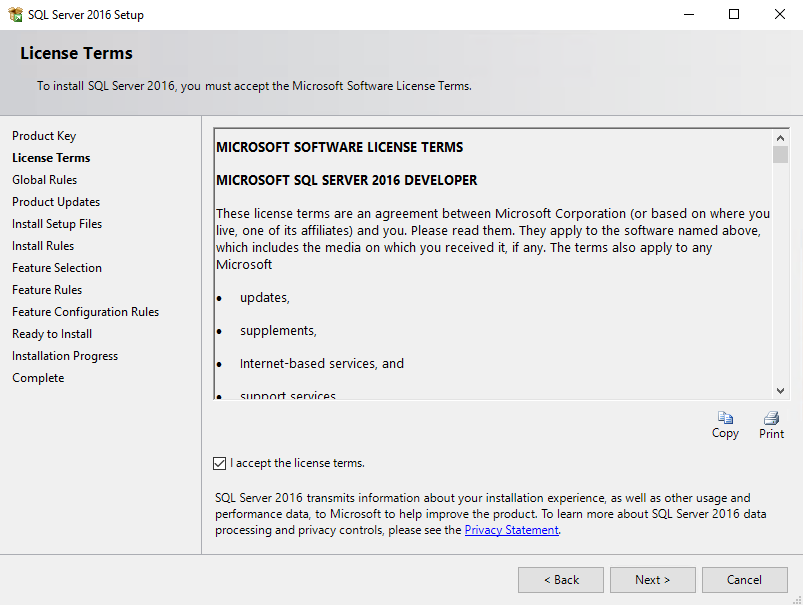
Skim the license agreement and press Next.
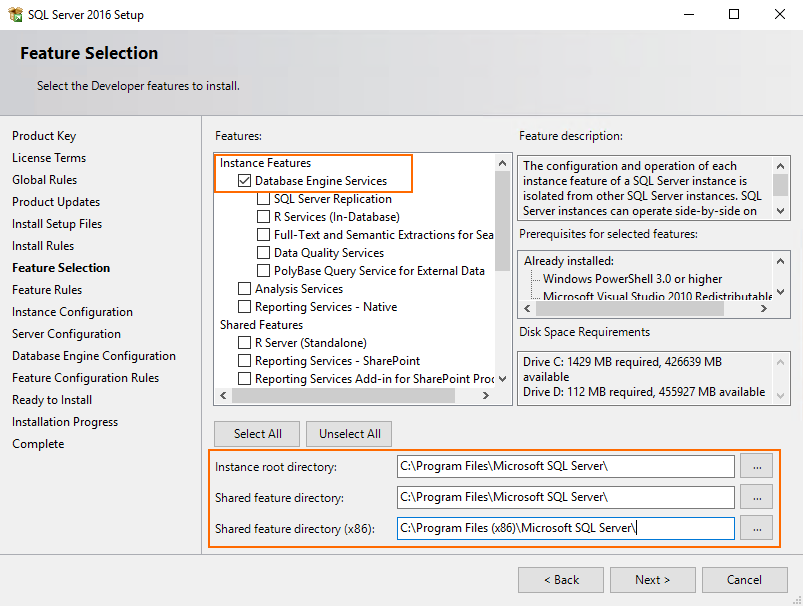
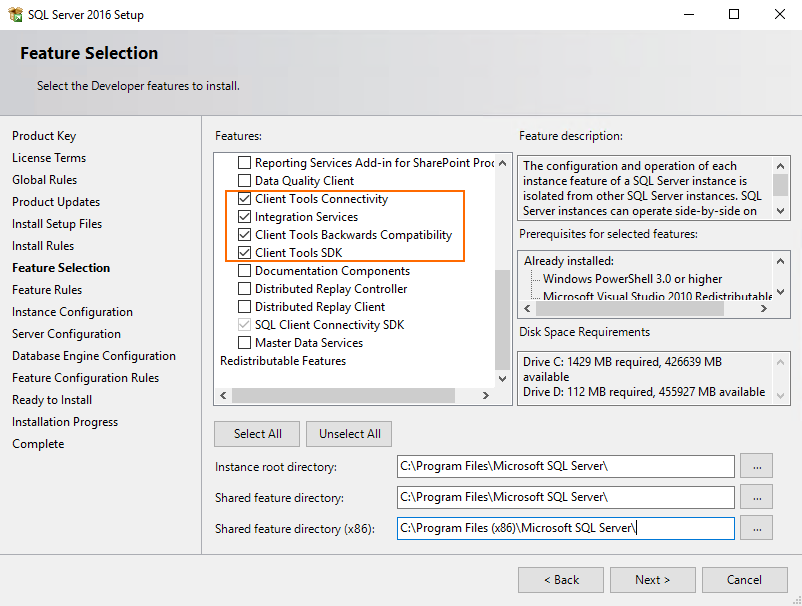
Afterward, select all the necessary components for installing the SQL Server and press Next again.
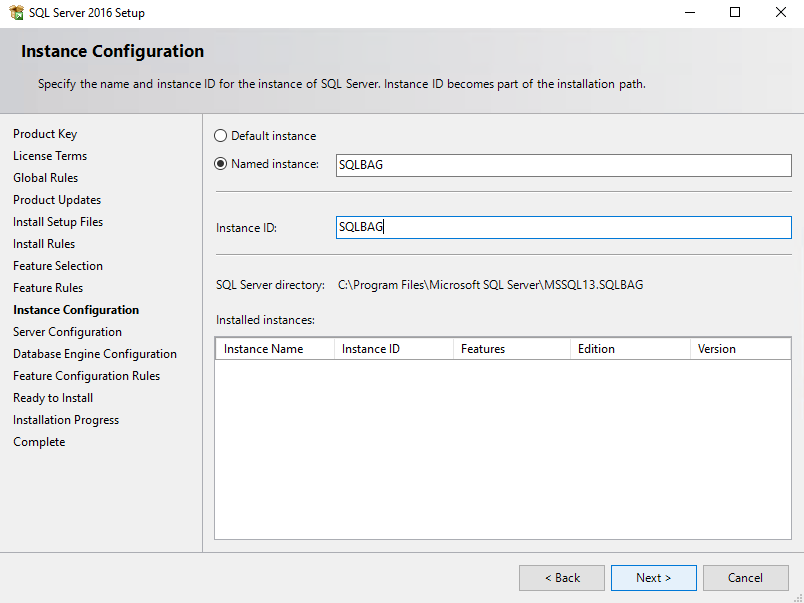
Enter the instance name and ID and click Next.
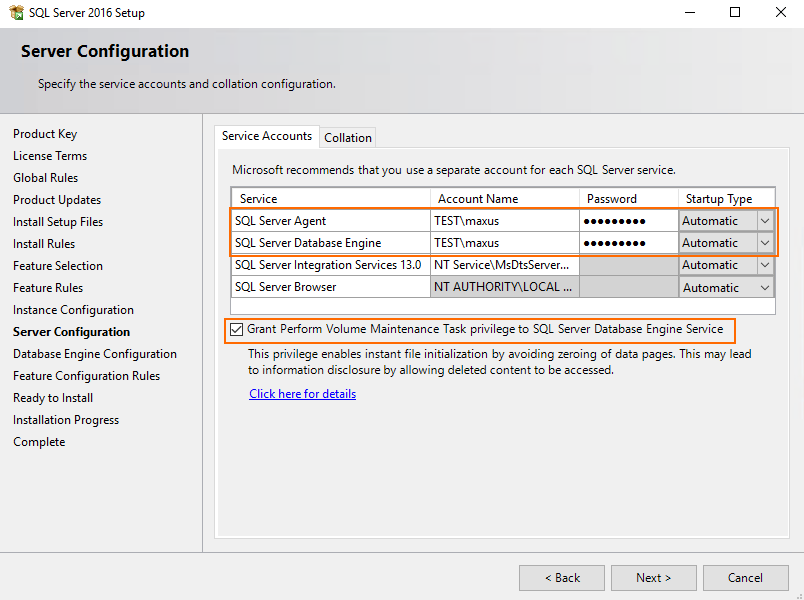
At the next step, specify the credentials for SQL Server Database Engine and SQL Server Agent. Just a friendly advice: use accounts that are on the same domain to avoid any possible troubles with BAG creation.
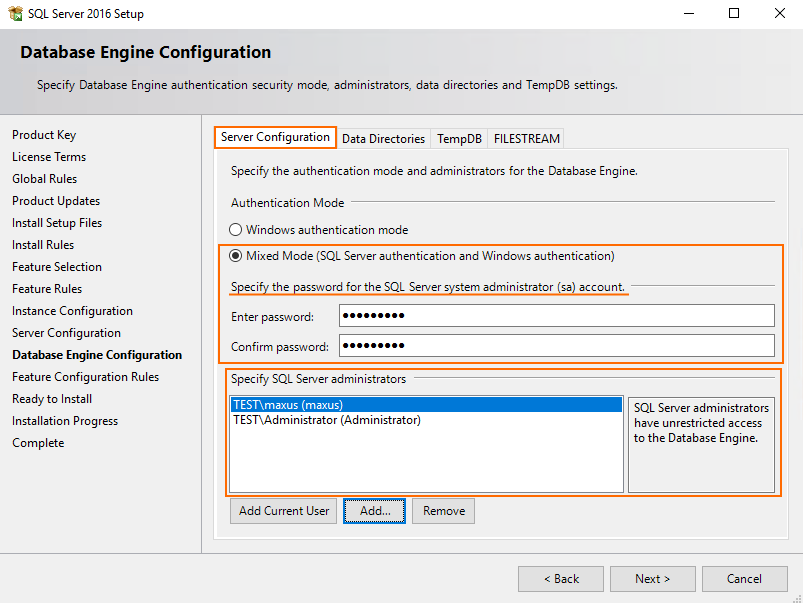
Specify the authentication mode and credentials for the SQL Server system administrator account.
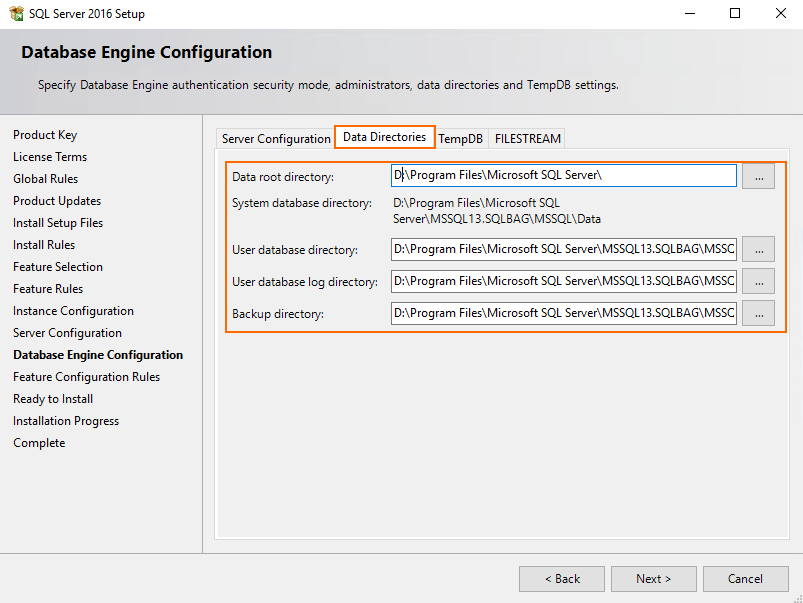
Afterward, specify the path to the database. In my case, D disk stands for the Intel SSD DC S3500 drive.
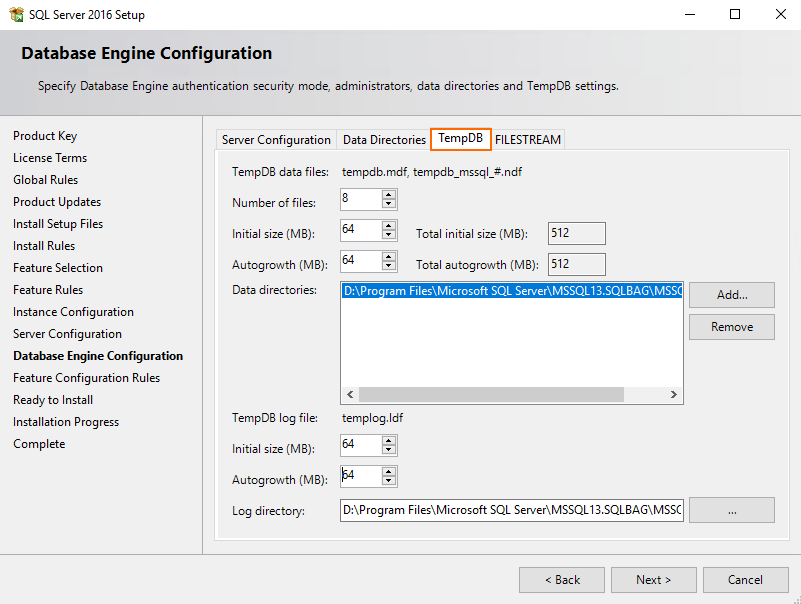
Next, go to the TempDB tab and set the TempDB data files and TempDB log files parameters.
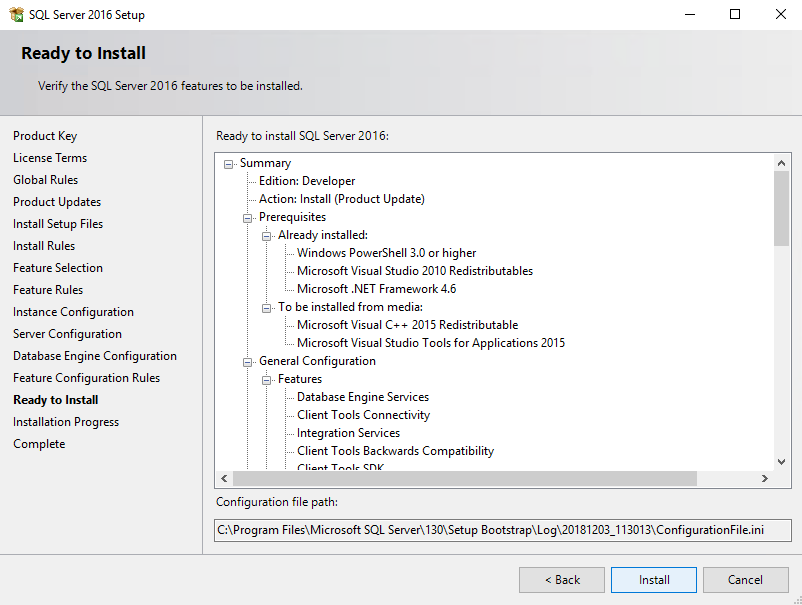
Eventually, verify all settings and press Install.
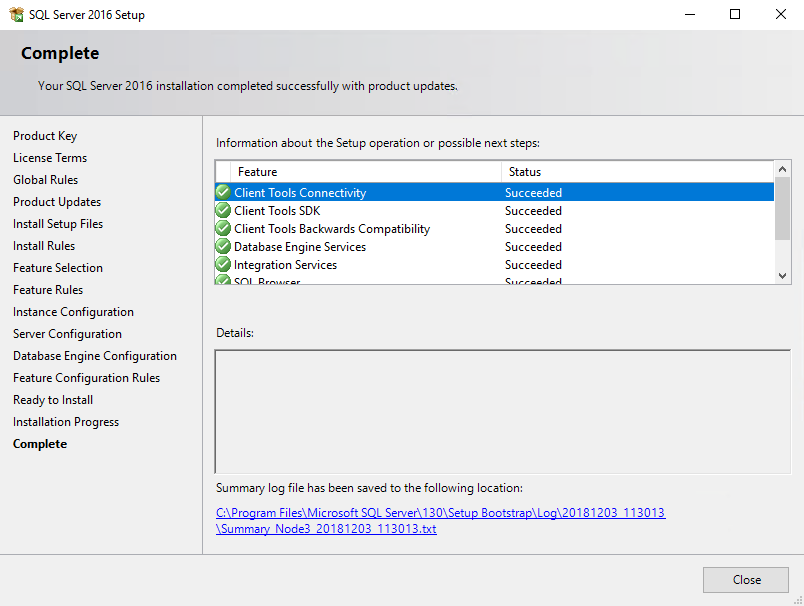
Wait until SQL Server installs and press Close.
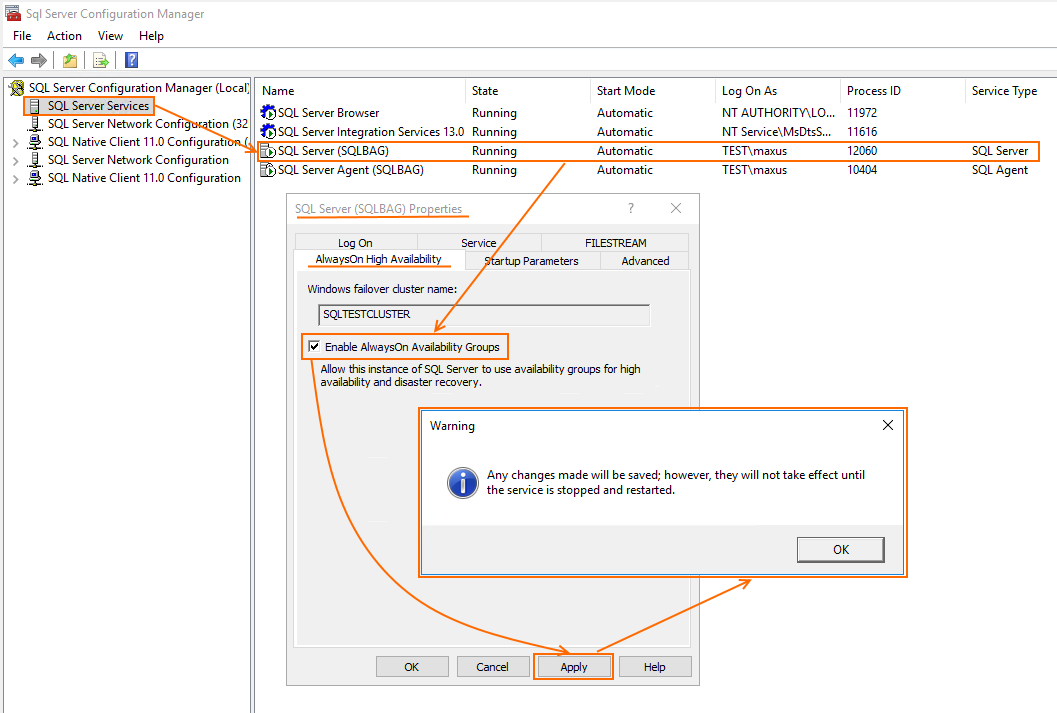
Now, start SQL Server (SQLBAG) Configuration Manager to enable AlwaysOn High Availability Groups. Find the detailed guide on how to do this in the screenshot below.
This is it for Node 3. Install SQL server on Node 4 now, and the cluster is good to go.
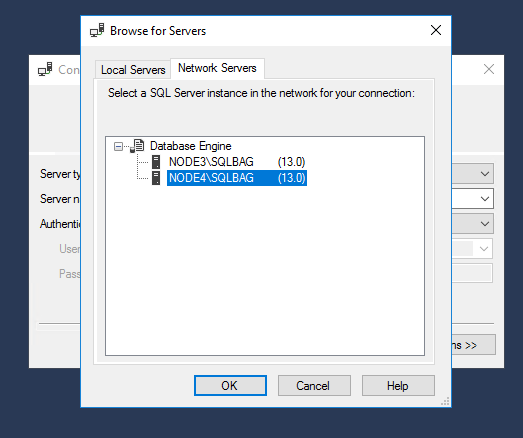
Once you are done, install Microsoft SQL Server Management Studio and connect both cluster nodes to SQL Server (SQLBAG).
Creating a database
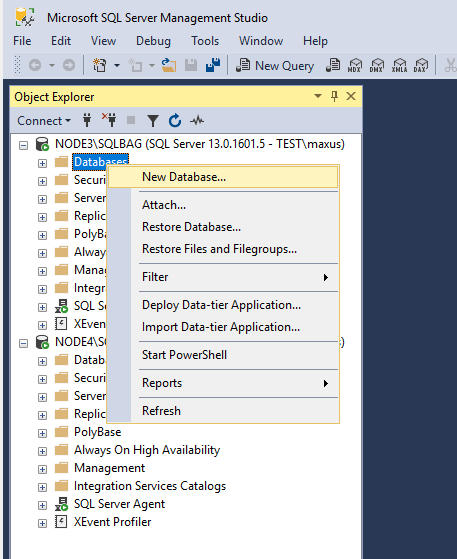
Let’s create the database now.
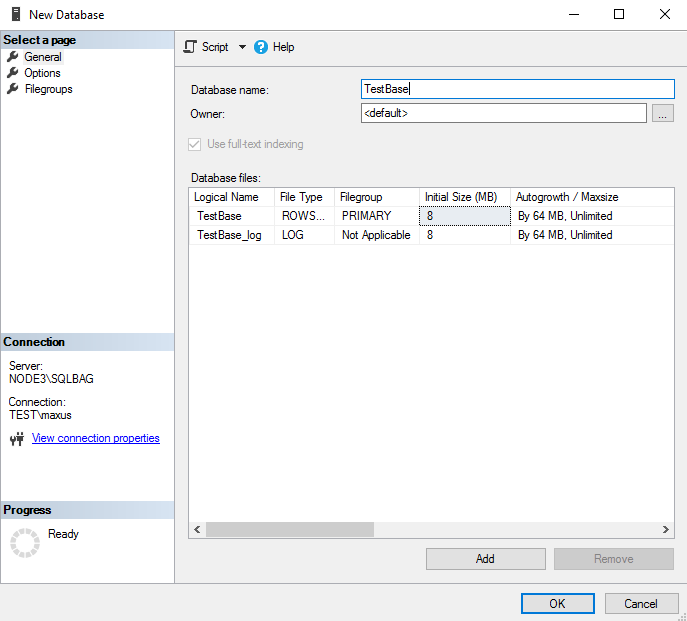
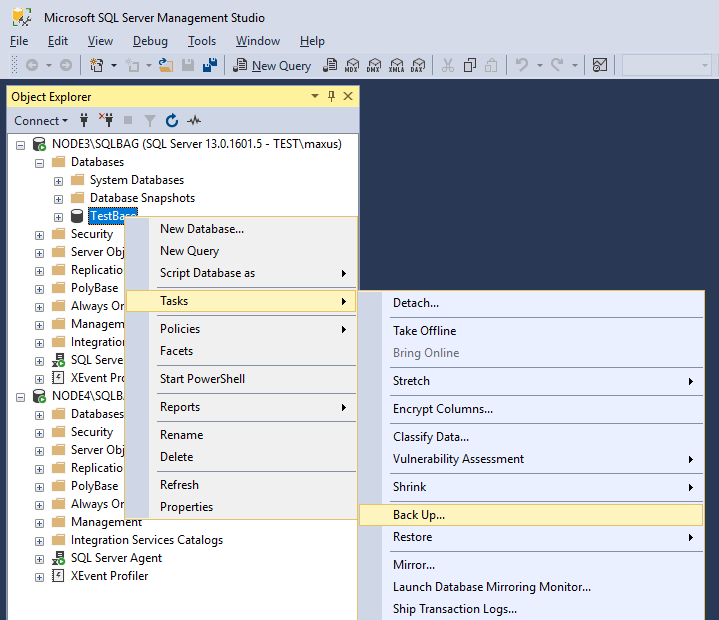
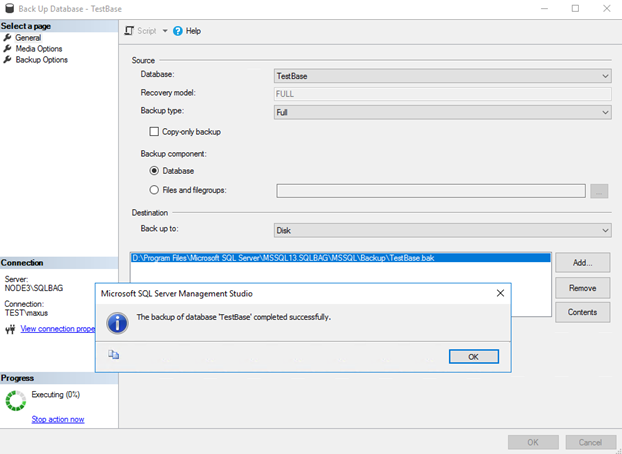
Name the database and back up it afterward.
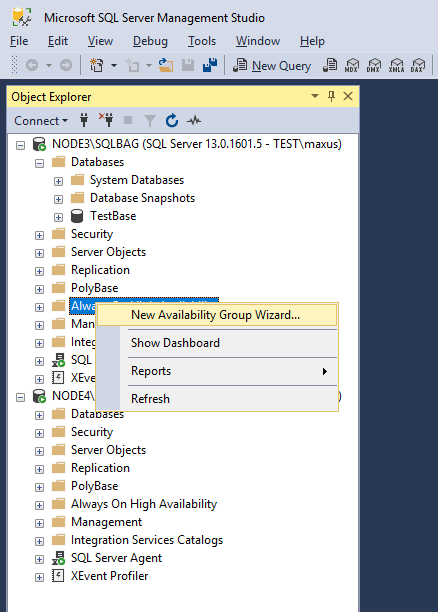
Create a new availability group
Once you are done with the backup process, create a new availability group.
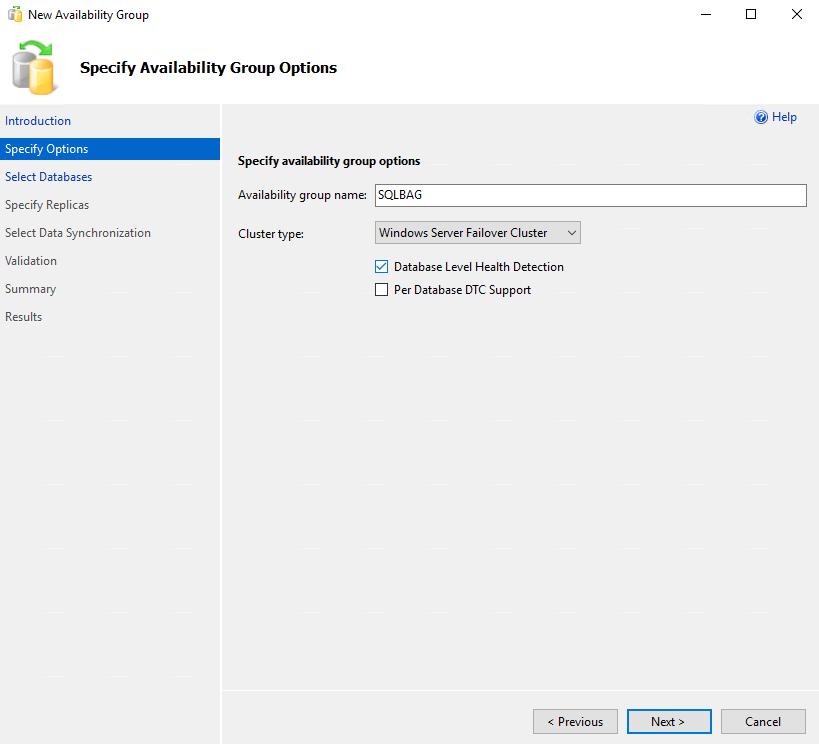
First, specify the availability group name and check the Database Level Health Detection box.
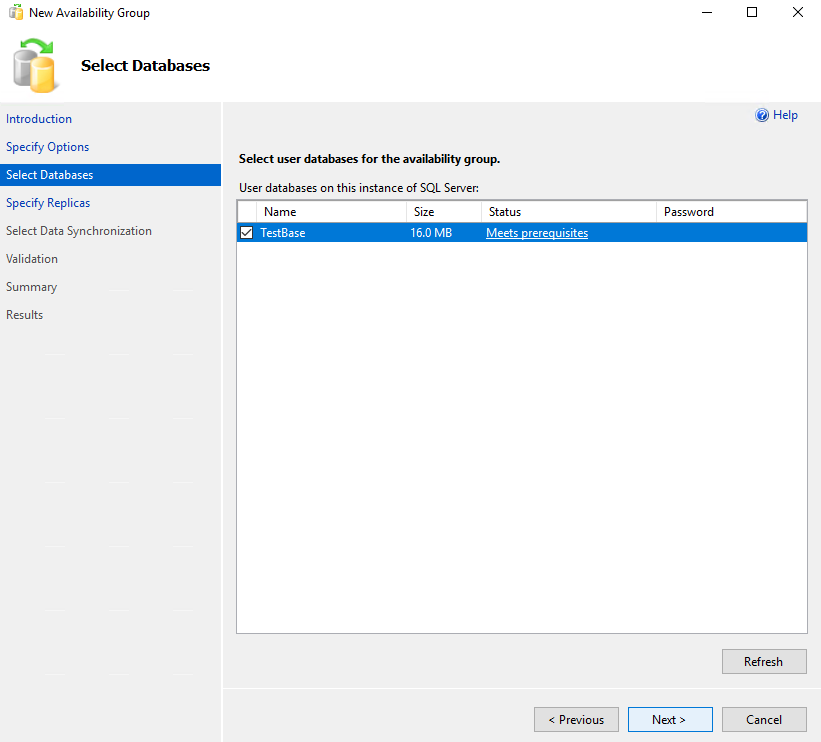
Select the database for VM creation and press Next.
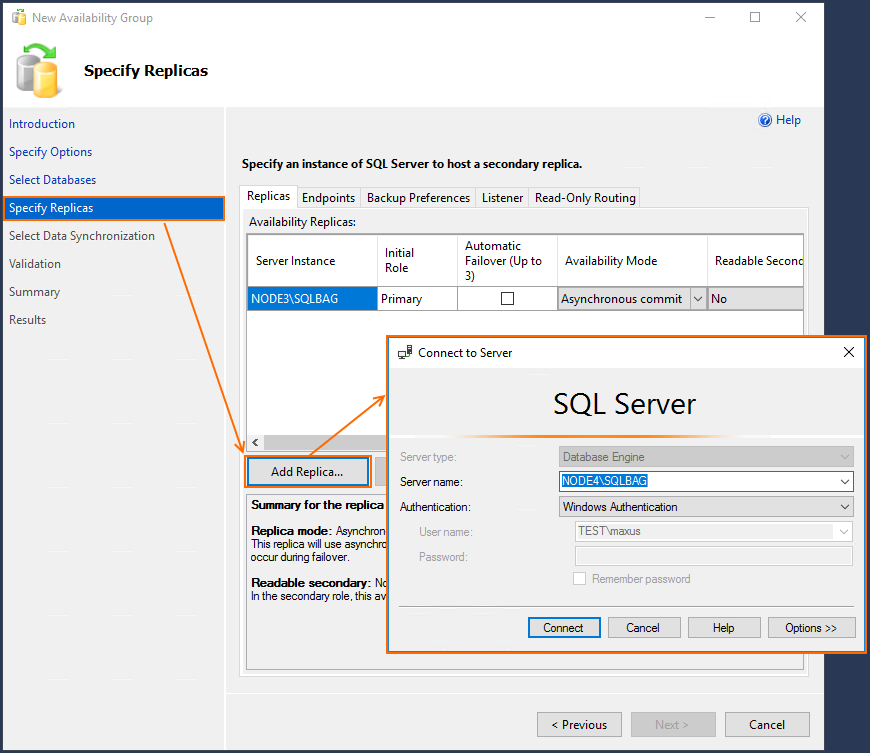
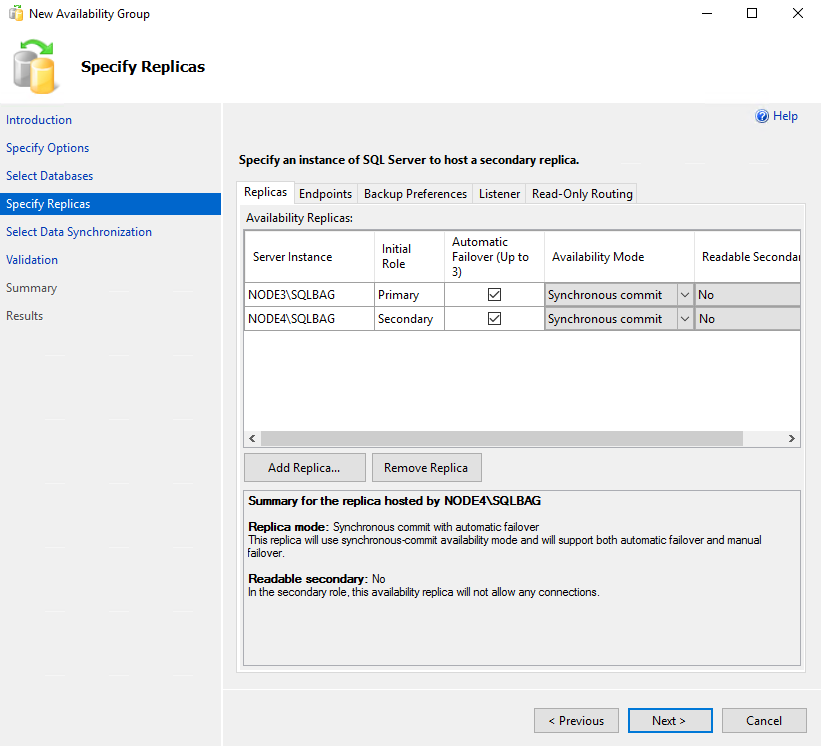
At the Specify Replicas stage, add the database replica. I decided to keep it on Node 4.
Here’s what I got at the end of the day.
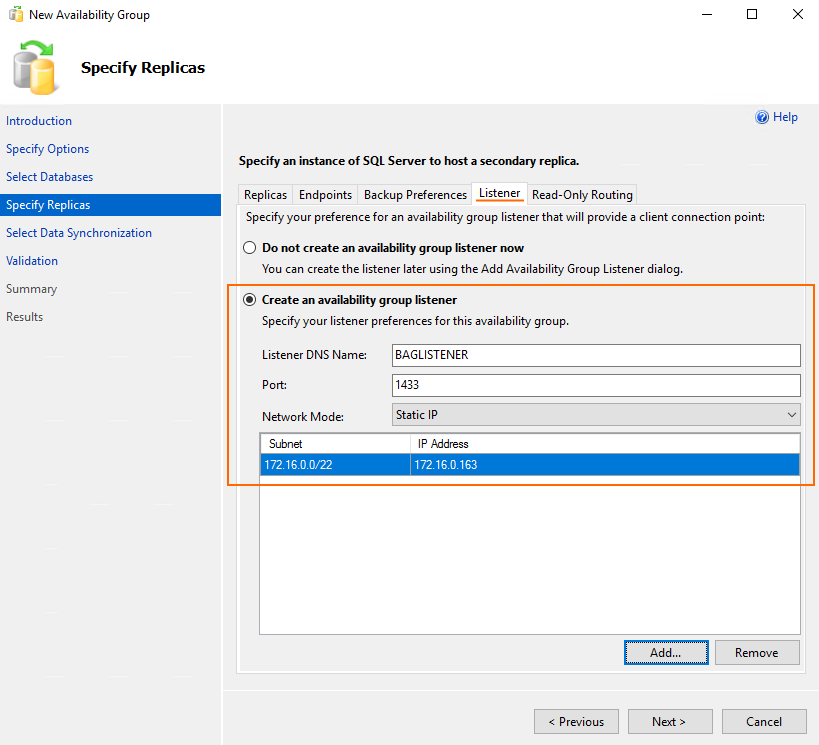
Next, go to the Listener tab and specify the name, port (1433), and IP address of the availability group listener.
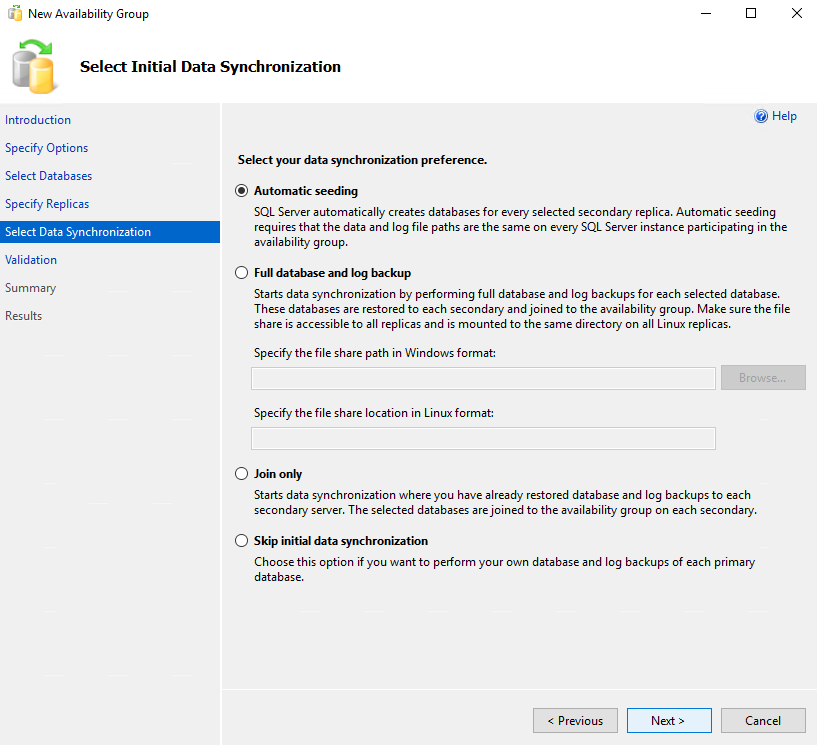
At the next step, select Automatic seeding as preferable synchronization preference, and click Next.
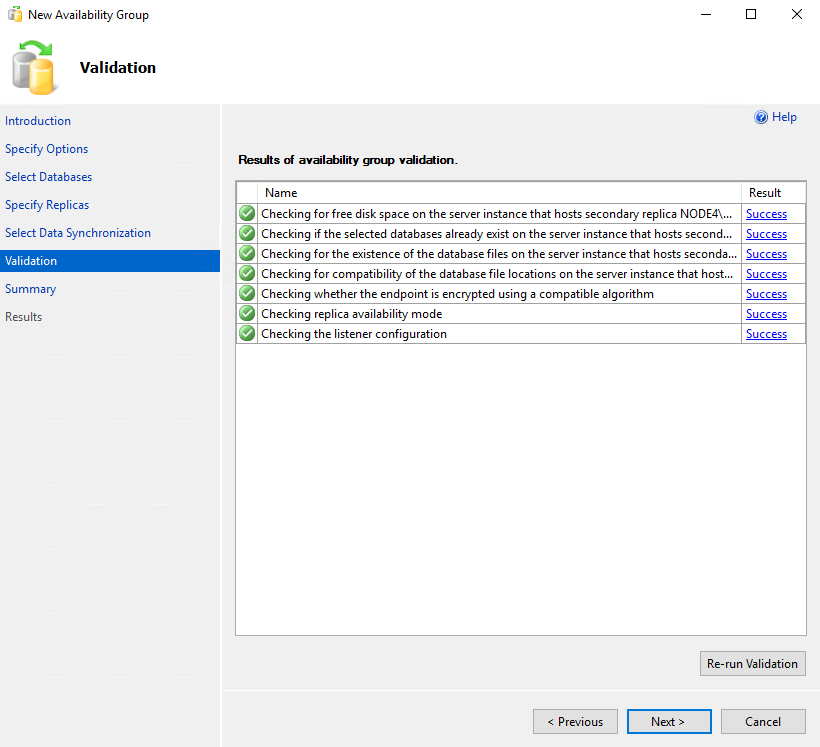
Press Next after successful validation.
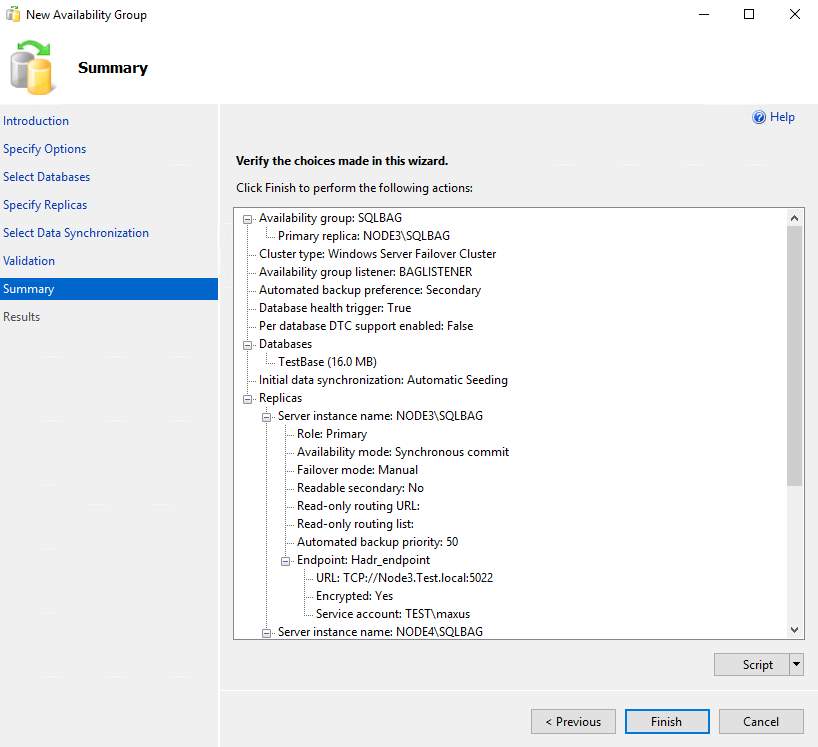
Look through the new availability group settings and press Finish to create a new availability group.
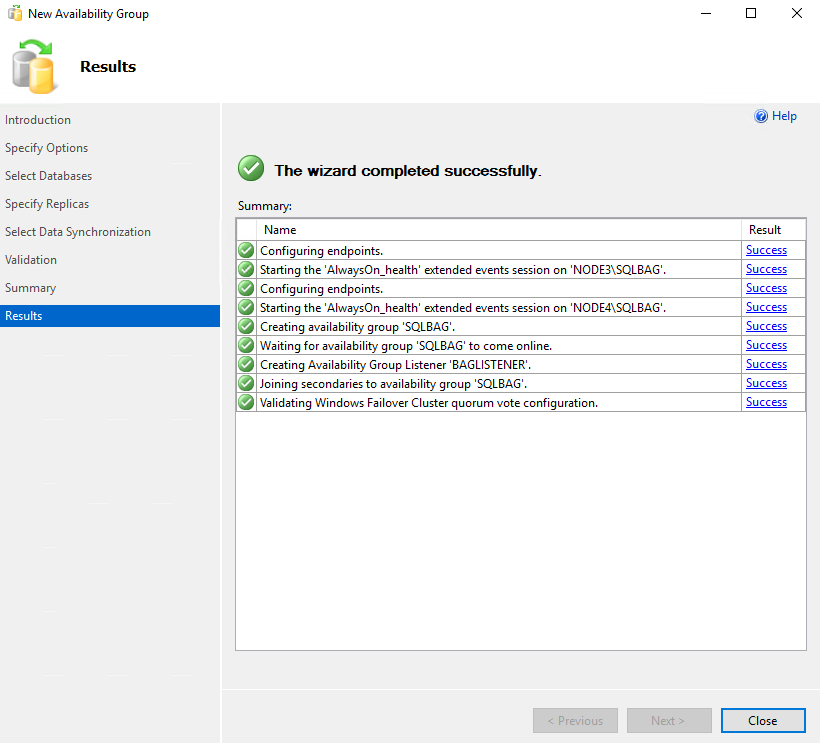
Once the wizard completes successfully, click Close.
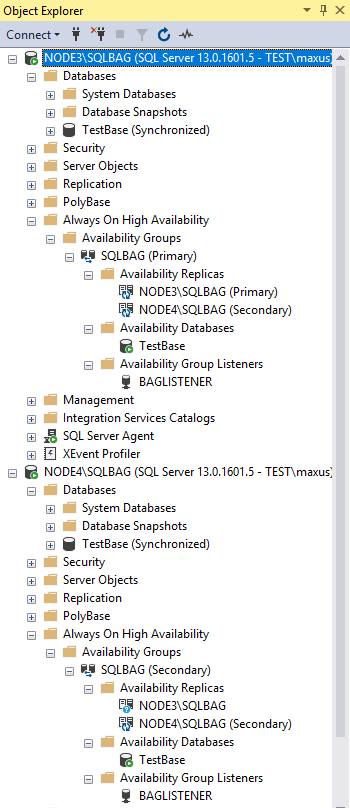
You can find a new availability group in Microsoft SQL Server Management Studio.
Filling in the database
Now, let’s flood TestBase with data using HammerDB.
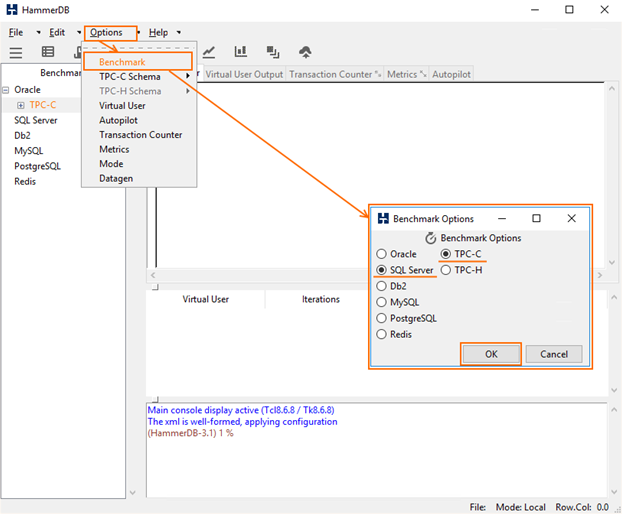
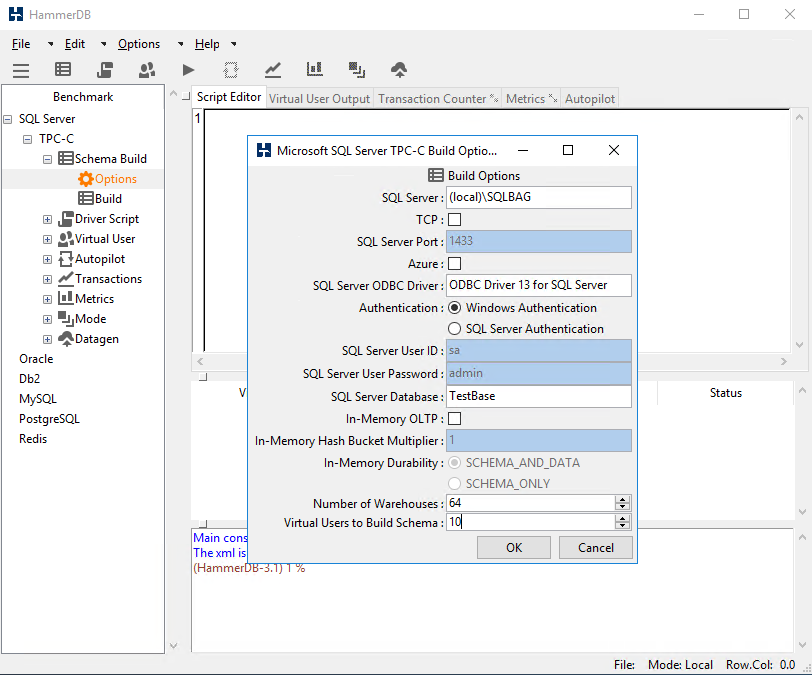
First, start HammerDB and select Benchmark from the Options menu. Set up the benchmarking options just like in the screenshot below.
In the Schema Build tab, set up the parameters of HammerDB connection to the database and specify the number of Virtual Users. This parameter addresses the number of threads used for filling in the database with data; so, throughout this article, I refer the Virtual Users number as the number of threads.
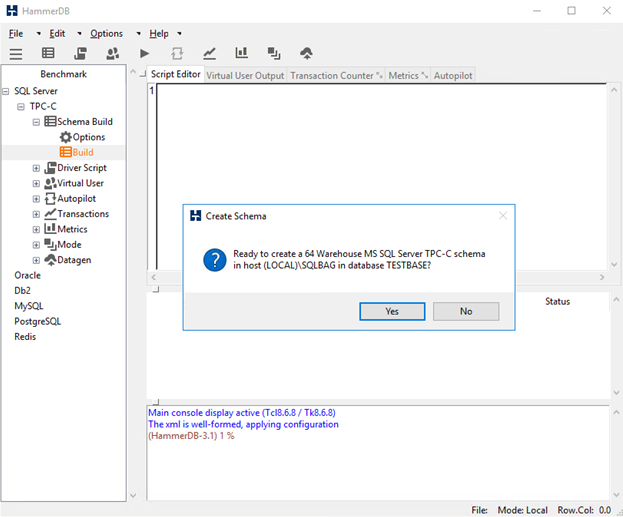
Once you have specified all settings, double-click Build to start filling in the database with data.
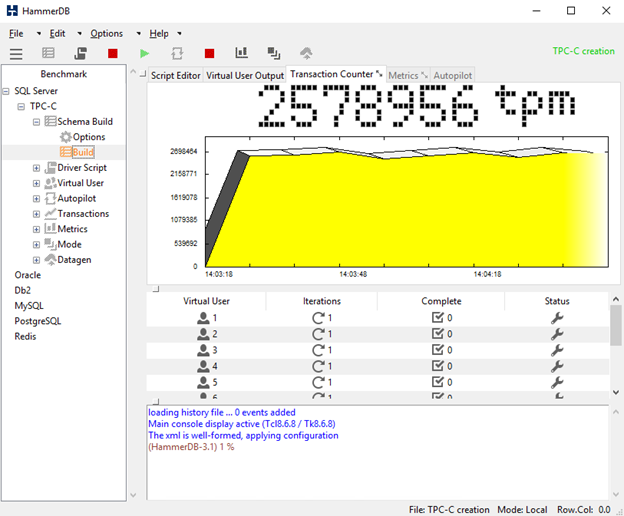
Once the process finishes, you’ll get a nice plot and the peak database writing performance.
Reducing the amount of RAM on each node
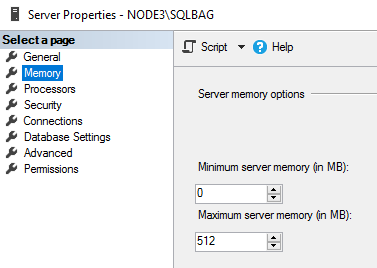
It should be noted that caching may alter the results. Regarding this fact, I decided to reduce the amount of available RAM for each node to 512 MB.
Testing SQL Server BAG performance
Finally, I got over with the installation process. Let’s now jump to BAG performance measurements!
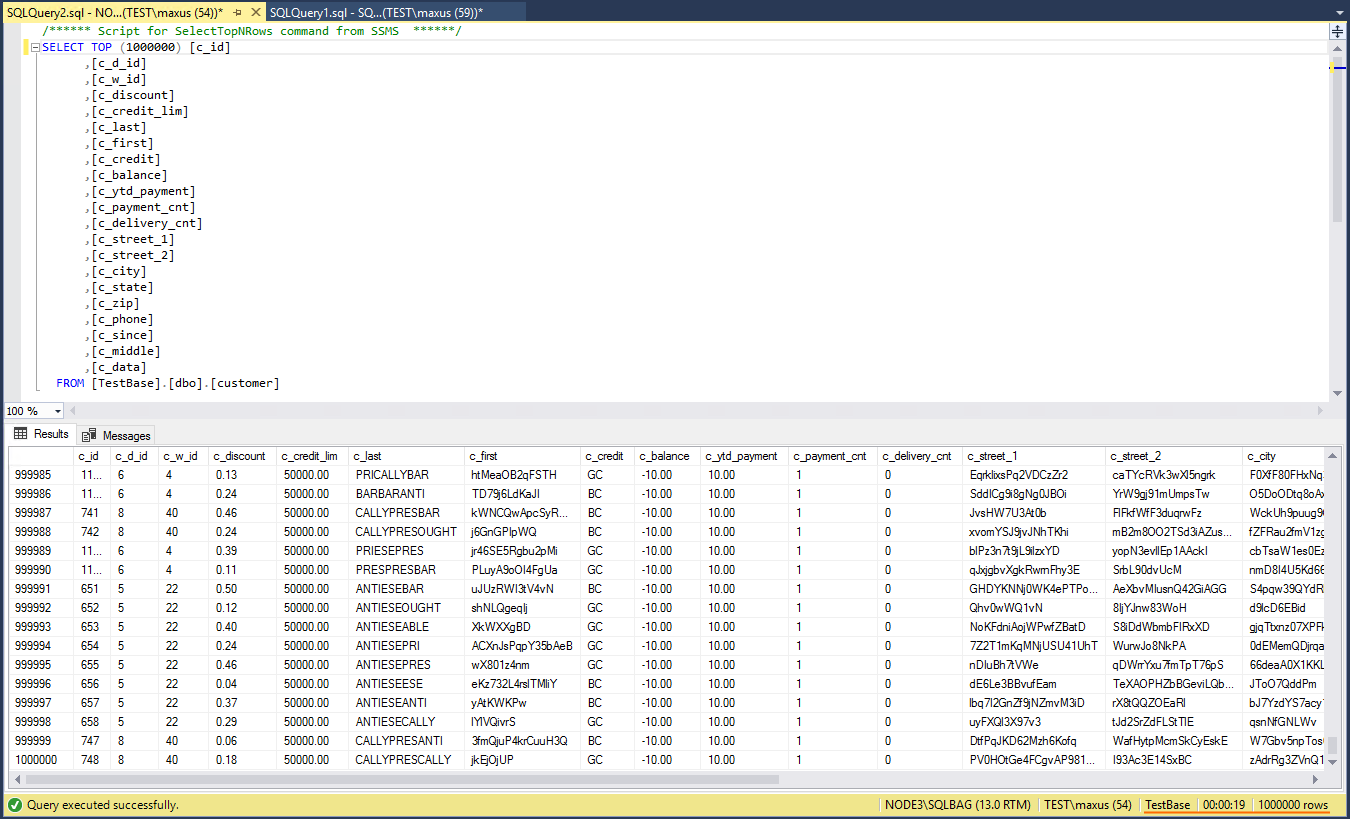
As we know writing performance, let’s find out SQL Server BAG reading performance. Go to Microsoft SQL Server Management Studio and execute the reading request of 1M rows from the dbo.customer table. In my case, it took around 19 secs to cope with this task.
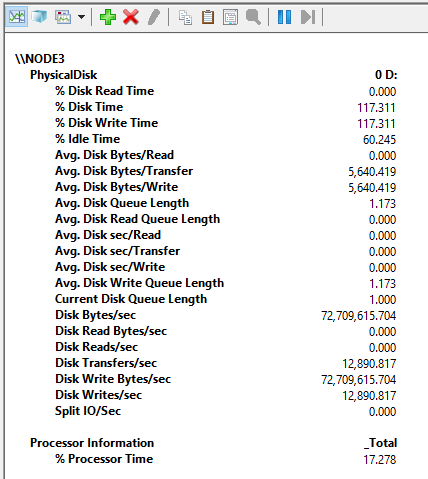
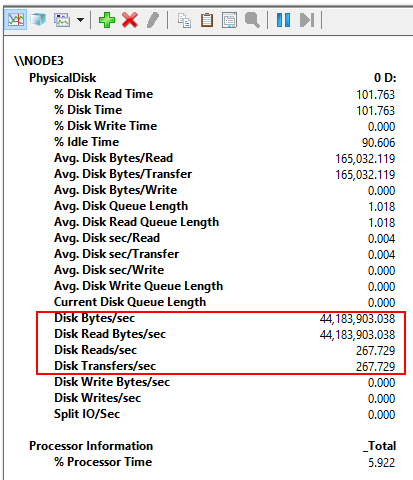
Here’s what maximum reading performance was like.
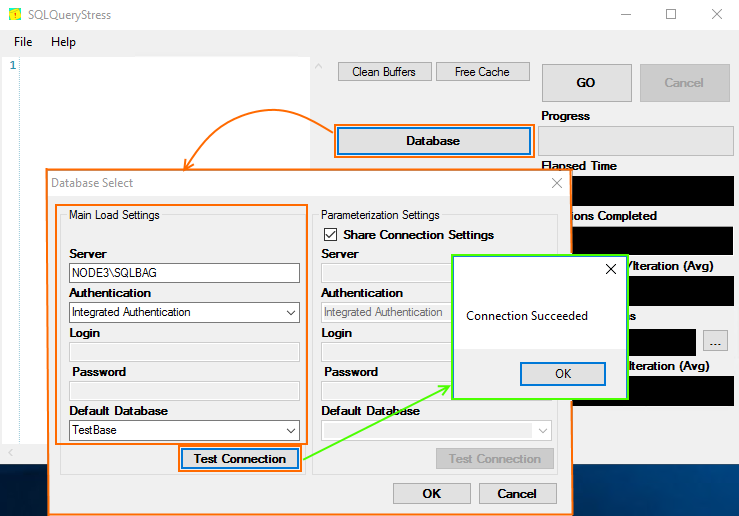
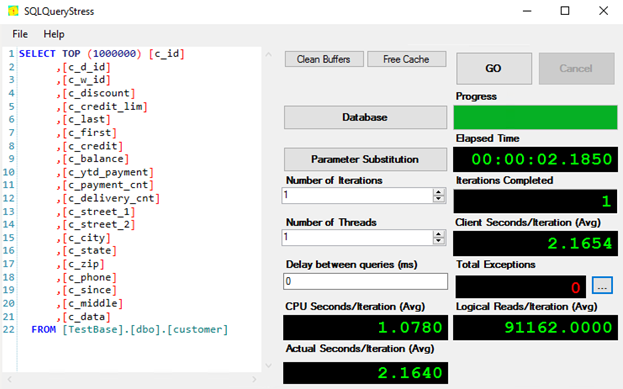
I also carried out the measurement with SQLQueryStress. This utility provides more room for experiments. For instance, you can change the number of threads in a pretty wide range (Number of Threads = 1,2,4,8,10,12). Actually, that’s what I want to do right now.
After launching SQLQueryStress, press Database. Enter the main load settings and run the connection test.
Next, at the homepage, form the request, specifying the number of threads, number of iterations, and delay between queries. Once you are done with setting up the utility, you are good to go.
Here are the results I got.
| SQL BAG | ||
|---|---|---|
| test run time, sec | SSD, MB/s | |
| threads=1 | 2,18 | 346 |
| threads=2 | 2,09 | 376 |
| threads=4 | 2,05 | 375 |
| threads=8 | 2,24 | 348 |
| threads=10 | 3,07 | 501 |
| threads=12 | 4,48 | 499 |
Now, let’s do just the same measurement with HammerDB (OLTP pattern). Let’s see how performance changes under varying number of threads (Virtual User = 1,2,4,8,10,12).
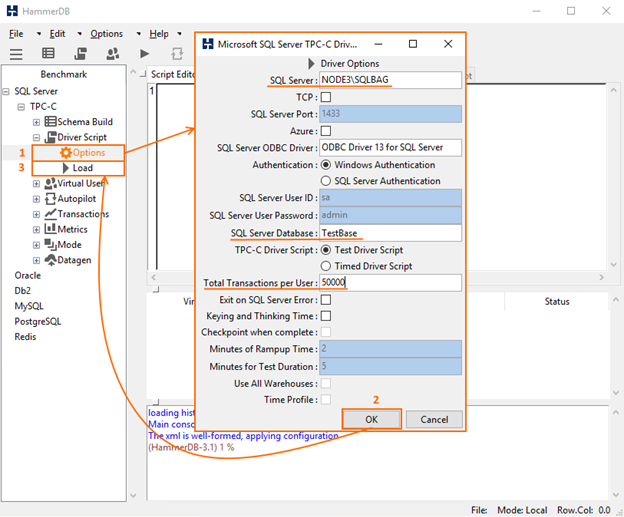
Launch HammerDB one more time. In the Driver Script menu, double-click Options and set up the testing parameters in the emerged window. Afterward, double-click Load to prepare the script for connecting the database.
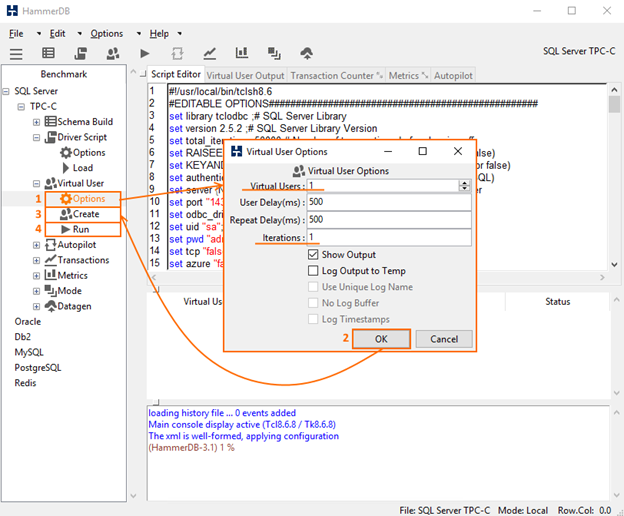
Now, go to the Virtual User menu and double-click Options to specify the number of virtual users and iterations in the self-titled fields. Press OK. Next, double-click Create to create the necessary amount of Virtual Users. Once you are done with setting up the utility, run the test.
The table below presents the results that I got with HammerDB under a varying number of threads value.
| SQL BAG test run time, min | |
|---|---|
| Virtual User=1 | 9 |
| Virtual User=2 | 8 |
| Virtual User=4 | 9 |
| Virtual User=8 | 8 |
| Virtual User =10 | 10 |
| Virtual User=12 | 12 |
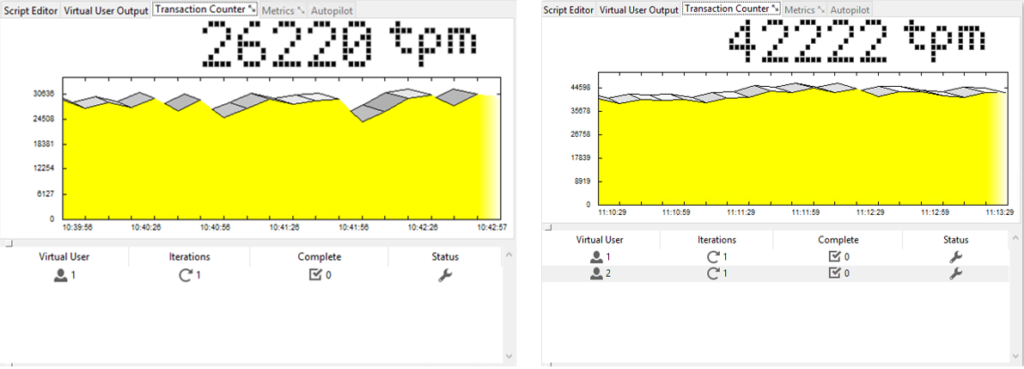
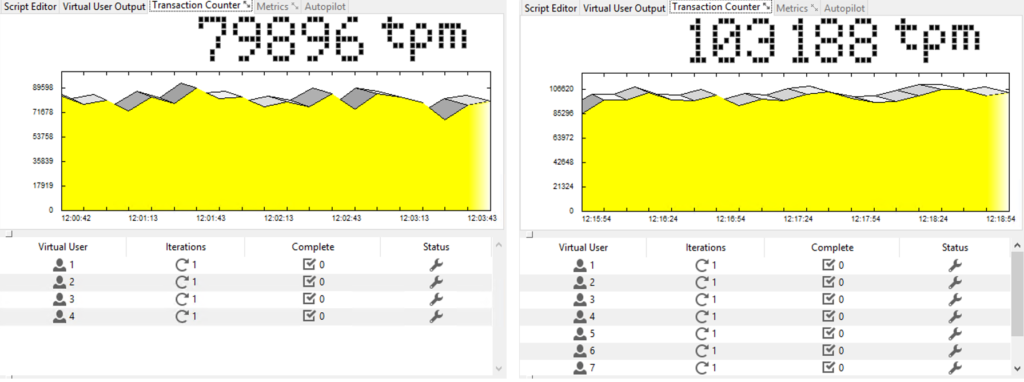
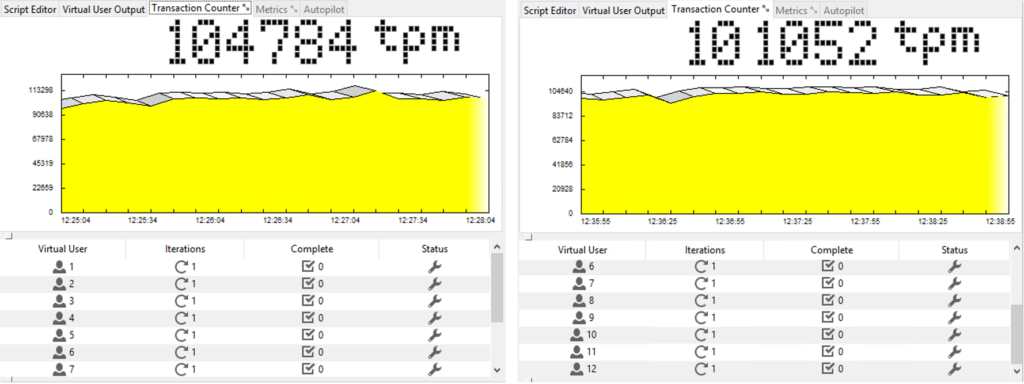
The thing which I noticed during the experiment is that the number of transactions per-minute increases when you shift to a higher Virtual Users number. Let me show what I am talking about.
Figures below address performance changes measured with HummerDB while increasing the number of virtual users.
Figure 1: Virtual Users = 1 and Virtual Users = 2
Figure 2: Virtual Users = 4 and Virtual Users =8
Figure 3: Virtual Users = 10 and Virtual Users = 12
CONCLUSION
I got some numbers for the performance of a 2-node SQL Server Basic Availability Groups cluster. In my next article, https://www.starwindsoftware.com/blog/hyper-v/can-sql-server-failover-cluster-instance-run-twice-fast-sql-server-basic-availability-groups-2-node-cluster-part-2-studying-fci-performance/, I discuss SQL Server Failover Cluster Instances performance on the same setup.
