Introduction
Even though this technology used to be a newcomer just a few years ago, it’s hard today to find somebody who hasn’t heard yet of the NVMe (Non-Volatile Memory Express) interface. Since NVMe technology doesn’t require a separate storage controller and commutes with the system CPU directly, it’s not a surprise to anybody that an NVMe SSD delivers much more IOPS and significantly lower latency than a SATA SSD analog for the same price. In other words, the prediction that NVMe will eventually replace SATA as a concept looks more and more like a matter of time, not chance.
However, much more potent SSDs aren’t the most exciting thing in this case. After all, NVMe devices have already been on the market for a couple of years, and there’s hardly a lot of new things to be told. Instead, let’s focus our attention on a continuation of this technology, namely Non-Volatile Memory Express over Fabrics (NVMe-oF) protocol specification.
The NVMe-oF was designed specifically to engage NVMe message-based commands in data transfer between a host and a target storage system. Unlike iSCSI, the NVMe-oF standard has much lower latency, thereby resulting in a data center having unprecedented access to NVMe SSD.
Right now, the only thing that keeps holding the data centers hostage to the local storage system is the unrivaled performance level: the faster data transferring is, the better it is for business. Any business. However, the implementation and configuring remote storage with similar performance could take business competitiveness and capability to another league. That’s when it gets interesting, because, long story short, NVMe-oF is essentially the same thing as ISCSI, with only principle difference being latency level. In fact, NVMe-oF adds so little to cross the network that it could rival the performance of local storage.
Purpose
Of course, we aren’t spending our time on these details for nothing. Although a relatively young technology, NVMe-oF has already seen a handful of implementations, including Linux NVMe-oF initiator for Linux and StarWind NVMe-oF Initiator for Windows. As I have already mentioned above, the NVMe-oF networking standard provides a latency level for remote storage so low that it almost doesn’t affect storage performance at all. Well, now, let’s take a look at just how much this is close to reality, shall we? We are going to compare respective performances of both NVMe-oF Initiators and see how much latency they actually add up to.
Benchmarking Methodology, Details & Results
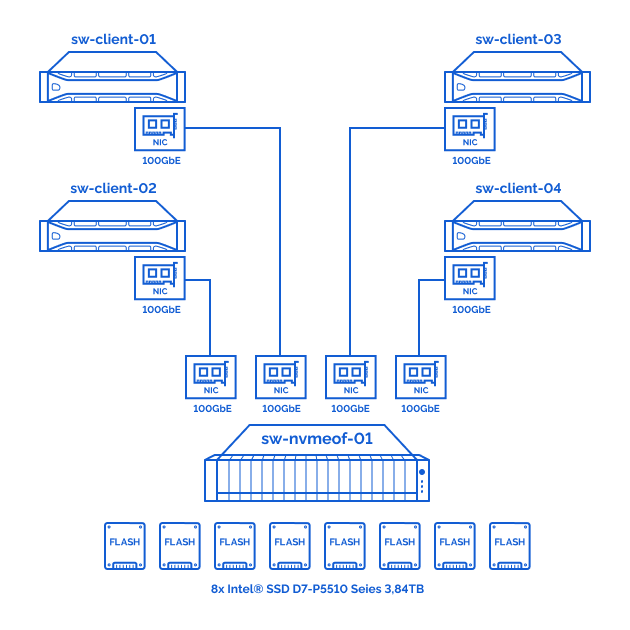
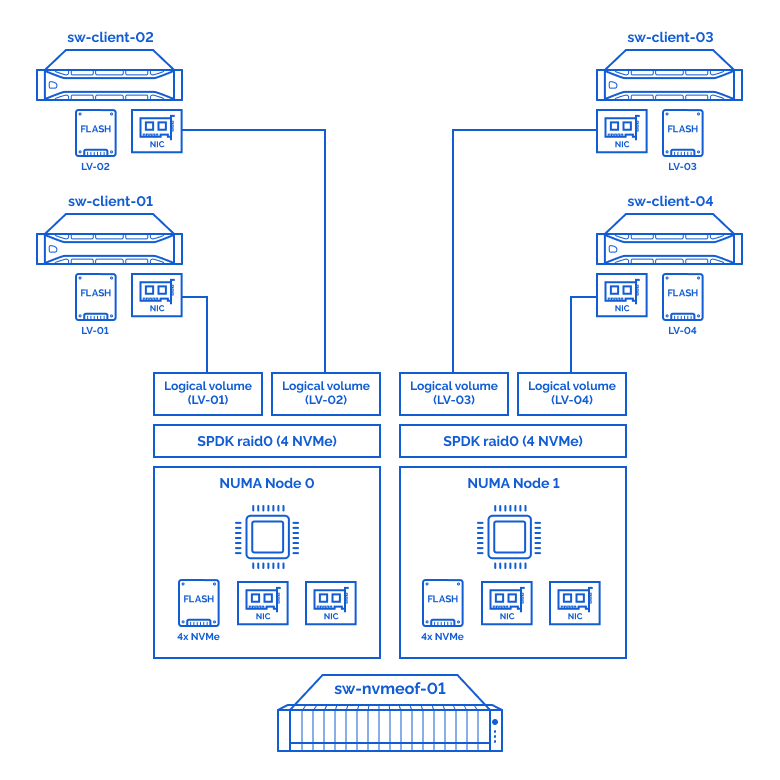
In our Storage Node (sw-nvmeof-01), half of the NVMe drives are located on NUMA node 0, and the other half on NUMA node 1. The same goes for the network cards.
In order to get maximum performance and avoid fluctuation and performance decrease caused by interaction and NUMA related context switching going between the two NUMA nodes, we have collected 2 RAID0 arrays keeping them assigned to the required NUMA nodes.
Testbed:
Testbed architecture overview:
Storage connection diagram:
Storage node:
Hardware:
| sw-nvmeof-01 | Intel M50CYP2SB2U |
|---|---|
| CPU | Intel(R) Xeon(R) Platinum 8380 CPU @ 2.30GHz |
| Sockets | 2 |
| Cores/tdreads | 80/160 |
| RAM | 512Gb |
| Storage | 8x (NVMe) – Intel® SSD D7-P5510 Series 3.84TB |
| NICs | 4x ConnectX®-5 EN 100GbE (MCX516A-CDAT) |
Software:
| OS | CentOS 8.4.2105 (kernel – 5.13.7-1.el8.elrepo) |
|---|---|
| SPDK | v21.07 release |
Clients nodes:
Hardware:
| sw-client-{01..04} | PowerEdge R740xd |
|---|---|
| CPU | Intel® Xeon® Gold 6130 Processor 2.10GHz |
| Sockets | 2 |
| Cores/tdreads | 32/64 |
| RAM | 256Gb |
| NICs | 1x ConnectX®-5 EN 100GbE (MCX516A-CCAT) |
Software:
Linux:
| OS | CentOS 8.4.2105 (kernel – 4.18.0-305.10.2) |
|---|---|
| nvme-cli | 1.12 |
| fio | 3.19 |
Windows:
| OS | Windows Server 2019 Standart Edition |
|---|---|
| StarWind NVMeoF initiator | 1.9.0.455 |
| fio | 3.27 |
The benchmark will be held using the fio utility since it’s the cross-platform tool designed specifically for storage synthetical benchmarking and is constantly updated and supported.
Despite the fact that applications use different block sizes and patterns to access the storage, we have used the benchmark patterns and block sizes below since these are the most common patterns for OS and the majority of performance-demanding applications.
The following patterns have been used during the benchmark:
- random read 4k;
- random write 4k;
- random read 64K;
- random write 64K;
- sequential read 1M;
- sequential write 1M.
A single test duration is 3600 seconds(1 hour), and prior to benchmarking the write operations, storage has been first warmed up for 1 hour. Finally, all the tests have been performed 3 times and the average value was used as a final result.
Now, let’s get to testing.
As the first step of the local storage benchmark testing stage, let’s agree to define the optimal parameters –numjobs and –iodepth as a performance/latency ratio for a single NVMe drive on the Storage Node (sw-nvmeof-01). After that, we are going to configure SPDK NVMe-oF targets, RAID0 and LUNs. Furthermore, to perform the over-the-network storage (remote storage) benchmark all we need to do is connect the LUNs on the client nodes over the network.
2.1 Linux NVMe-oF initiator;
2.2StarWind NVMe-oF Initiator.
Local storage benchmark:
By the following link you could find the official maximum performance values declared by Intel:
We have reached the optimal (performance/latency) performance of a singleNVMe drive under the following parameters:
| 1x Intel® SSD D7-P5510 Series 3.84TB | |||||
|---|---|---|---|---|---|
| pattern | numjobs | iodepth | IOPs | MiB\s | lat (ms) |
| random read 4k | 8 | 32 | 712000 | 2780 | 0,359 |
| random write 4k | 4 | 4 | 195992 | 766 | 0,081 |
| random read 64K | 2 | 32 | 101000 | 6326 | 0,632 |
| random write 64K | 2 | 1 | 14315 | 895 | 0,139 |
| read 1M | 2 | 4 | 6348 | 6348 | 1,259 |
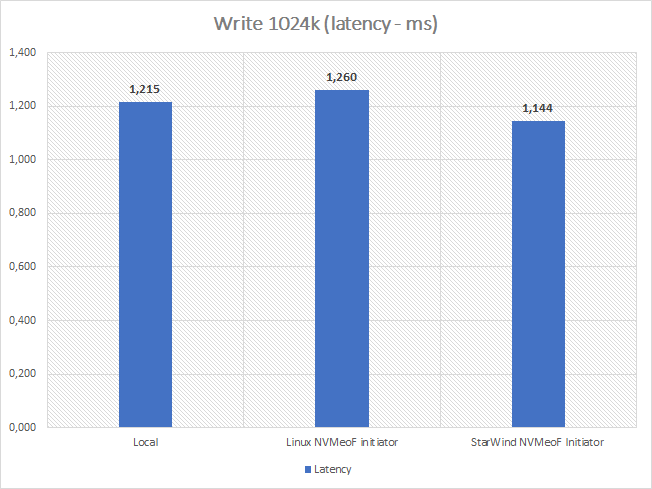
| write 1M | 1 | 4 | 3290 | 3290 | 1,215 |
Accordingly, we should get the following values out of8 NVMe drives combined:
| 8x Intel® SSD D7-P5510 Series 3.84TB | |||
|---|---|---|---|
| pattern | IOPs | MiB\s | lat (ms) |
| random read 4k | 5696000 | 22240 | 0,359 |
| random write 4k | 1567939 | 6125 | 0,081 |
| random read 64K | 808000 | 50608 | 0,632 |
| random write 64K | 114520 | 7158 | 0,139 |
| read 1M | 50784 | 50784 | 1,259 |
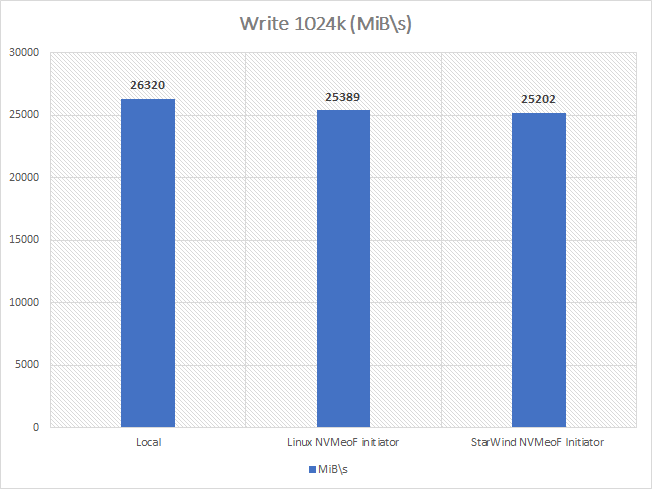
| write 1M | 26320 | 26320 | 1,215 |
Remote storage benchmark:
So taking into the account that we have 8 NVMe drives and 4 client nodes, we should,theoretically,get the performance of 2 NVMe drives from each client node. Therefore, in comparison with local storage testing, we will double the –numjobs value for random patterns and double the –iodepth value for sequentials in fio parameters for each client node.
We will run fio on each client with the following parameters:
Linux:
fio parameters
#Random Read 4k:

fio --name=nvme --rw=randread --numjobs=16 --iodepth=32 --blocksize=4K --direct=1 --ioengine=libaio --time_based=1 --group_reporting=1 --lat_percentiles=1 --filename=/dev/nvme0n1 --runtime=3600#Random Write 4k:
fio --name=nvme --rw=randwrite --numjobs=8 --iodepth=4 --blocksize=4K --direct=1 --ioengine=libaio --time_based=1 --group_reporting=1 --lat_percentiles=1 --filename=/dev/nvme0n1 --runtime=3600#Random Read 64k:
fio --name=nvme --rw=randread --numjobs=4 --iodepth=32 --blocksize=64K --direct=1 --ioengine=libaio --time_based=1 --group_reporting=1 --lat_percentiles=1 --filename=/dev/nvme0n1 --runtime=3600#Random Write 64k:
fio --name=nvme --rw=randwrite --numjobs=4 --iodepth=1 --blocksize=64K --direct=1 --ioengine=libaio --time_based=1 --group_reporting=1 --lat_percentiles=1 --filename=/dev/nvme0n1 --runtime=3600#Read 1024k:
fio --name=nvme --rw=read --numjobs=2 --iodepth=4 --blocksize=1024K --direct=1 --ioengine=libaio --time_based=1 --group_reporting=1 --lat_percentiles=1 --filename=/dev/nvme0n1 --runtime=3600#Write 1024k:
fio --name=nvme --rw=write --numjobs=4 --iodepth=1 --blocksize=1024K --direct=1 --ioengine=libaio --time_based=1 --group_reporting=1 --lat_percentiles=1 --filename=/dev/nvme0n1 --runtime=3600Windows:
fio parameters
#Random Read 4k:

fio --name=nvme --thread --rw=randread --numjobs=16 --iodepth=32 --blocksize=4K --direct=1 --ioengine=windowsaio --time_based=1 --group_reporting=1 --lat_percentiles=1 --filename=\\.\PhysicalDrive2 --runtime=3600#Random Write 4k:
fio --name=nvme --thread --rw=randwrite --numjobs=8 --iodepth=4 --blocksize=4K --direct=1 --ioengine=windowsaio --time_based=1 --group_reporting=1 --lat_percentiles=1 --filename=\\.\PhysicalDrive2 --runtime=3600#Random Read 64k:
fio --name=nvme --thread --rw=randread --numjobs=4 --iodepth=32 --blocksize=64K --direct=1 --ioengine=windowsaio --time_based=1 --group_reporting=1 --lat_percentiles=1 --filename=\\.\PhysicalDrive2 --runtime=3600#Random Write 64k:
fio --name=nvme --thread --rw=randwrite --numjobs=4 --iodepth=1 --blocksize=64K --direct=1 --ioengine=windowsaio --time_based=1 --group_reporting=1 --lat_percentiles=1 --filename=\\.\PhysicalDrive2 --runtime=3600#Read 1024k:
fio --name=nvme --thread --rw=read --numjobs=2 --iodepth=4 --blocksize=1024K --direct=1 --ioengine=windowsaio --time_based=1 --group_reporting=1 --lat_percentiles=1 --filename=\\.\PhysicalDrive2 --runtime=3600#Write 1024k:
fio --name=nvme --thread --rw=write --numjobs=4 --iodepth=1 --blocksize=1024K --direct=1 --ioengine=windowsaio --time_based=1 --group_reporting=1 --lat_percentiles=1 --filename=\\.\PhysicalDrive2 --runtime=3600Benchmark results for Linux NVMeoF initiator:
| Linux NVMeoF initiator – 4 clients (cumulatively) | ||||||
|---|---|---|---|---|---|---|
| pattern | numjobs* | iodepth* | IOPs | MiB\s | lat (ms) | CPU usage |
| random read 4k | 16 | 32 | 5540879 | 21644,06 | 0,369 | 16,00% |
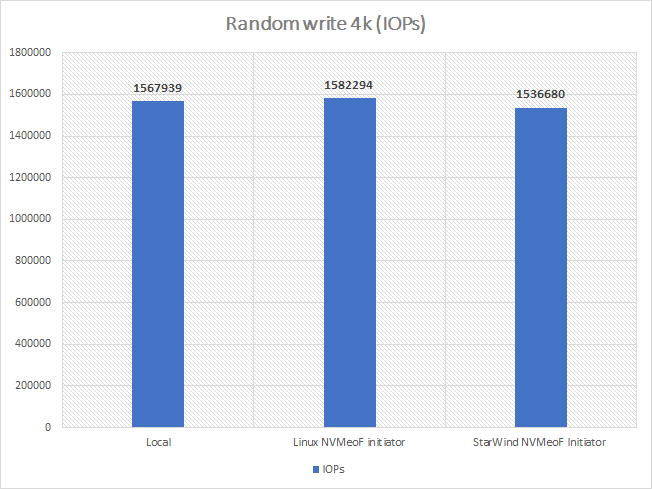
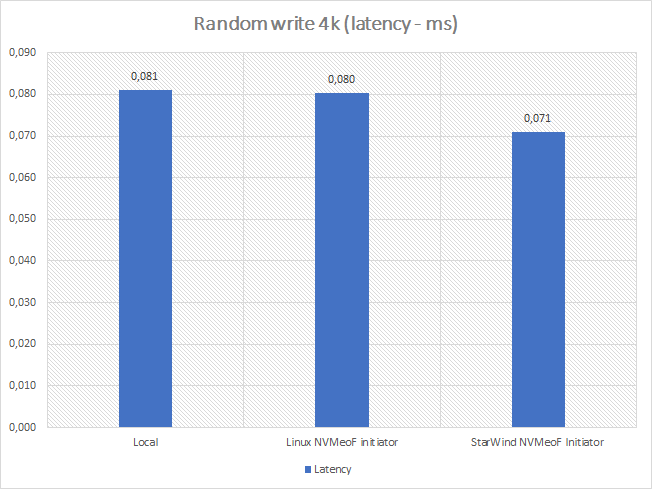
| random write 4k | 8 | 4 | 1582294 | 6181 | 0,080 | 5,30% |
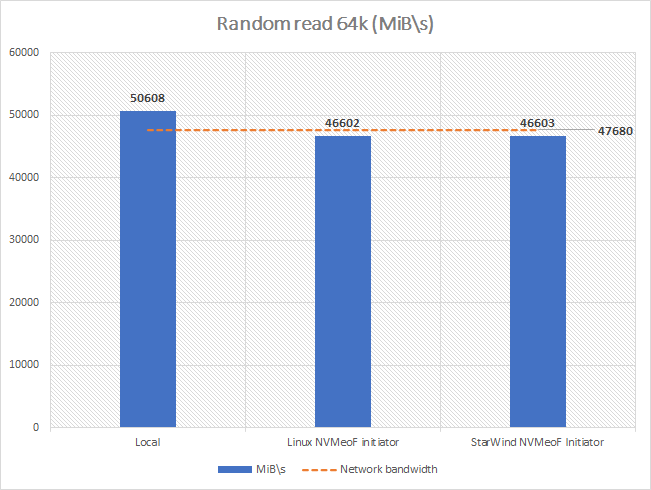
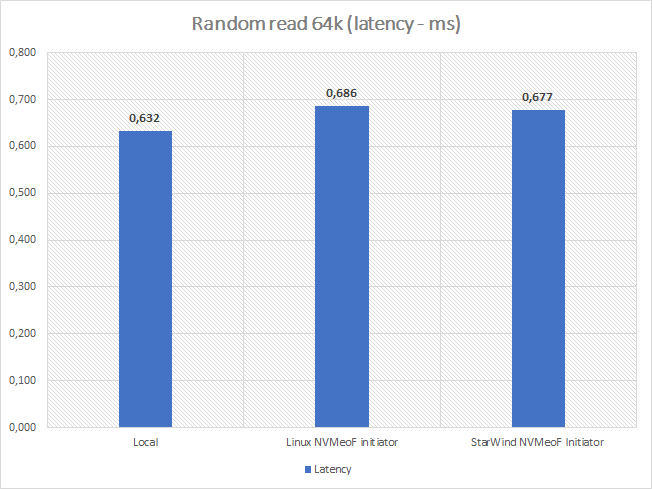
| random read 64K** | 4 | 32 | 745625 | 46602 | 0,686 | 3,50% |
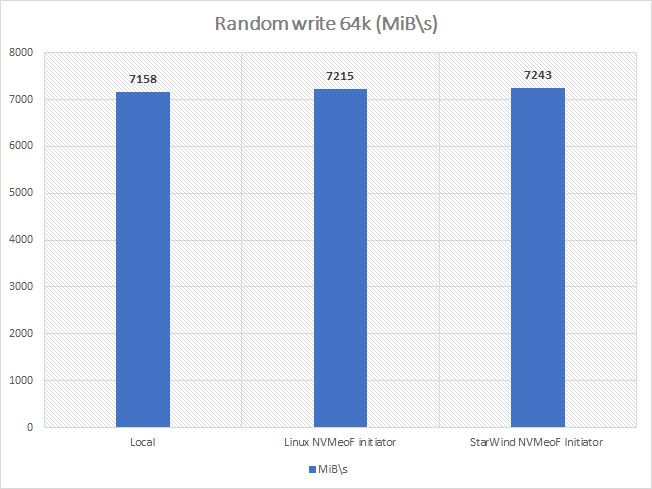
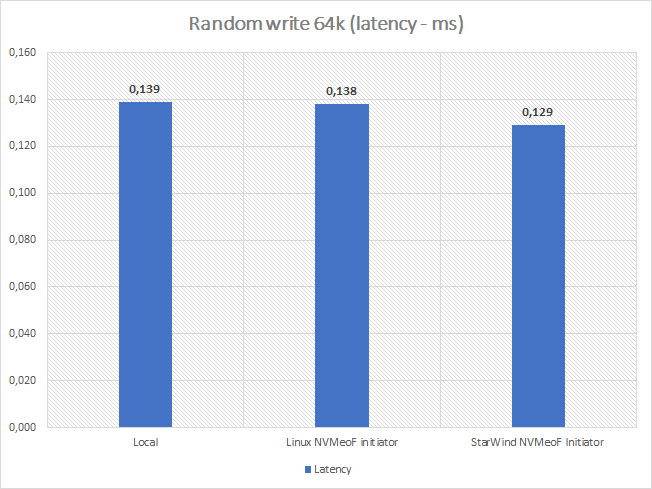
| random write 64K | 4 | 1 | 115447 | 7215 | 0,138 | 0,80% |
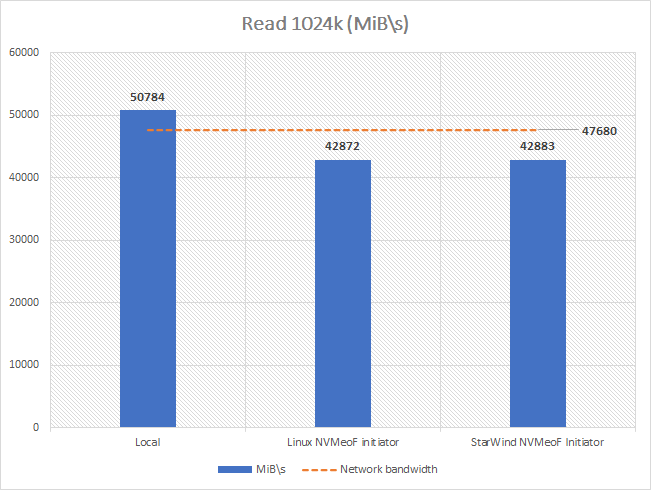
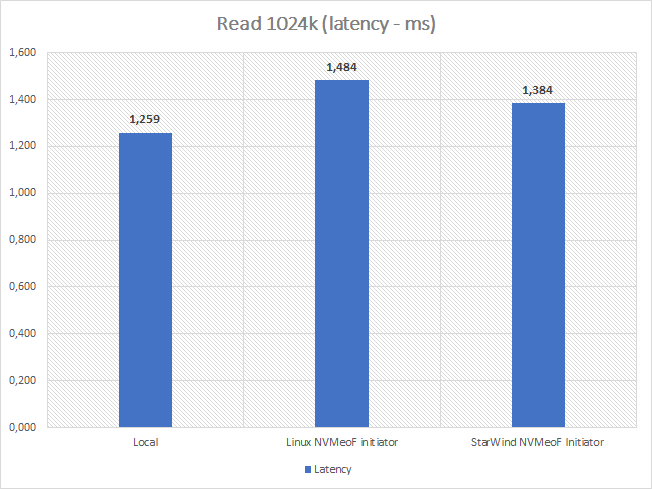
| read 1M** | 2 | 8 | 42871 | 42872 | 1,484 | 1,10% |
| write 1M | 1 | 8 | 25388 | 25389 | 1,260 | 0,80% |
| 8x Intel® SSD D7-P5510 Series 3.84TB | Linux NVMeoF initiator 4 clients (cumulatively) |
Comparison | |||||||
|---|---|---|---|---|---|---|---|---|---|
| pattern | IOPs | MiB\s | lat (ms) | IOPs | MiB\s | lat (ms) | IOPs | MiB\s | lat (ms) |
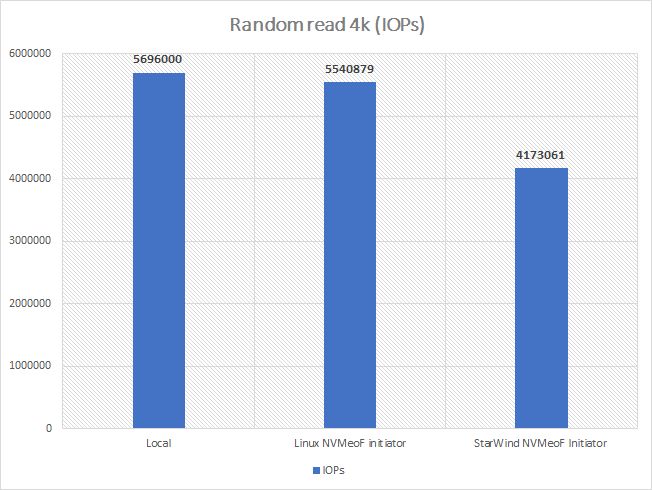
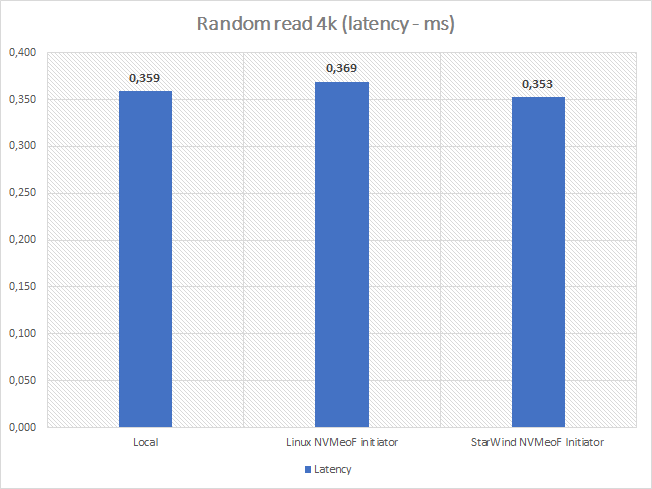
| random read 4k | 5696000 | 22240 | 0,359 | 5540879 | 21644,06 | 0,369 | 97,28% | 97,32% | 102,80% |
| random write 4k | 1567939 | 6125 | 0,081 | 1582294 | 6181 | 0,080 | 100,92% | 100,92% | 99,25% |
| random read 64K** | 808000 | 50608 | 0,632 | 745625 | 46602 | 0,686 | 92,28% | 92,08% | 108,58% |
| random write 64K | 114520 | 7158 | 0,139 | 115447 | 7215 | 0,138 | 100,81% | 100,81% | 99,26% |
| read 1M** | 50784 | 50784 | 1,259 | 42871 | 42872 | 1,484 | 84,42% | 84,42% | 117,90% |
| write 1M | 26320 | 26320 | 1,215 | 25388 | 25389 | 1,260 | 96,46% | 96,46% | 103,70% |
*-parameters specified for a single client;
**-we hit the network throughput bottleneck.
As we can observe from the results obtained, on all the patterns (except for those where we hit the network throughput bottleneck)the performance is practically identical to that of the underlying storage (+-4%).
Benchmark results for StarWind NVMe-oF Initiator:
| StarWind NVMeoF Initiator – 4 clients (cumulatively) | ||||||
|---|---|---|---|---|---|---|
| pattern | numjobs | iodepth | IOPs | MiB\s | lat (ms) | CPU usage |
| random read 4k | 16 | 32 | 4173061 | 16301 | 0,353 | 44,00% |
| random write 4k | 8 | 4 | 1536680 | 6003 | 0,071 | 16,00% |
| random read 64K** | 4 | 32 | 745647 | 46603 | 0,677 | 9,00% |
| random write 64K | 4 | 1 | 115880 | 7243 | 0,129 | 3,00% |
| read 1M** | 2 | 8 | 42882 | 42883 | 1,384 | 4,00% |
| write 1M | 1 | 8 | 25201 | 25202 | 1,144 | 3,00% |
| 8x Intel® SSD D7-P5510 Series 3.84TB | StarWind NVMeoF Initiator 4 clients (cumulatively) |
Comparison | |||||||
|---|---|---|---|---|---|---|---|---|---|
| pattern | IOPs | MiB\s | lat (ms) | IOPs | MiB\s | lat (ms) | IOPs | MiB\s | lat (ms) |
| random read 4k | 5696000 | 22240 | 0,359 | 4173061 | 16301 | 0,353 | 73,26% | 73,30% | 98,33% |
| random write 4k | 1567939 | 6125 | 0,081 | 1536680 | 6003 | 0,071 | 98,01% | 98,01% | 87,62% |
| random read 64K** | 808000 | 50608 | 0,632 | 745647 | 46603 | 0,677 | 92,28% | 92,09% | 107,12% |
| random write 64K | 114520 | 7158 | 0,139 | 115880 | 7243 | 0,129 | 101,19% | 101,19% | 92,81% |
| read 1M** | 50784 | 50784 | 1,259 | 42882 | 42883 | 1,384 | 84,44% | 84,44% | 109,93% |
| write 1M | 26320 | 26320 | 1,215 | 25201 | 25202 | 1,144 | 95,75% | 95,75% | 94,16% |
*-parameters specified for a single client;
**-we hit the network throughput bottleneck.
As we can see, the benchmark results are similar to those of Linux NVMe-oF Initiator except for the random read 4k pattern.
Performance comparison:Linux NVMe-oF initiator vs StarWind NVMe-oF Initiator:
| Linux NVMeoF initiator 4 clients (cumulatively) |
StarWind NVMeoF Initiator 4 clients (cumulatively) |
Comparison | ||||||||||
|---|---|---|---|---|---|---|---|---|---|---|---|---|
| pattern | IOPs | MiB\s | lat (ms) | CPU usage | IOPs | MiB\s | lat (ms) | CPU usage | IOPs | MiB\s | lat (ms) | CPU usage |
| random read 4k | 5540879 | 21644,06 | 0,369 | 16,00% | 4173061 | 16301 | 0,353 | 44,00% | 75,31% | 75,31% | 95,65% | 275,00% |
| random write 4k | 1582294 | 6181 | 0,080 | 5,30% | 1536680 | 6003 | 0,071 | 16,00% | 97,12% | 97,12% | 88,28% | 301,89% |
| random read 64K | 745625 | 46602 | 0,686 | 3,50% | 745647 | 46603 | 0,677 | 9,00% | 100,00% | 100,00% | 98,66% | 257,14% |
| random write 64K | 115447 | 7215 | 0,138 | 0,80% | 115880 | 7243 | 0,129 | 3,00% | 100,38% | 100,38% | 93,50% | 375,00% |
| read 1M | 42871 | 42872 | 1,484 | 1,10% | 42882 | 42883 | 1,384 | 4,00% | 100,03% | 100,03% | 93,24% | 363,64% |
| write 1M | 25388 | 25389 | 1,260 | 0,80% | 25201 | 25202 | 1,144 | 3,00% | 99,26% | 99,26% | 90,80% | 375,00% |
Performance comparison diagrams:
Conclusion
It is not easy to simply conclude as the results are showing quite an ambiguous picture. At large, the sum of the results shows that StarWind NVMe-oF Initiator for Windows at times does maybe 75-80% of the IOPS Linux NVMe-oF initiator can do on the same hardware and this comes at sometimes 3x-4x times of CPU usage cost. Does this mean that the Linux NVMe-oF initiator is much more efficient than the StarWind solution or that the latter possesses some inherent flaws? No, it doesn’t.
Windows Server still has the same issue with enormous overhead & added latency for the asynchronous I/O processing. It is quite simple to explain since the Windows storage stack was designed when storage devices were slow, while CPUs were a lot faster. In particular, spinning disk latency used to be (and still is) measured in milliseconds, when CPU & main system memory all deal with nanoseconds. Within the Windows Server storage stack, I/Os are being re-queued and handled by the different worker threads, which means additional time expenses. Such a situation may not matter much for the spinning disk, but it murders the performance for the super-fast NVMe storage that can do hundreds of thousands of the I/Os at that time. On the other hand, Linux has a zero-copy storage stack, user-mode drivers, and polling mode adding very low latency on top of what storage hardware has. Essentially, StarWind NVMe-oF Initiator for Windows, unlike its Linux counterpart, is basically stuck with Storport virtual miniport for a driver and has to deal with a short (254) command queues per logical unit and kernel worker thread context switches (all of this means extra latency).
Overall, the benchmark of both NVMe-oF Initiators has proven that NVMe-oF technology can be effectively used to share fast storage over a network, practically, without the performance decrease. StarWind NVMe-oF Initiator for Windows has proven that despite complexities caused by certain platform specifics it handles big blocks and long I/O queues perfectly well, still being the only efficient option to successfully share NVMe storage across the Windows network.
This material has been prepared in collaboration with Viktor Kushnir, Technical Writer with almost 3 years of experience at StarWind.
