I’m currently discovering Microsoft OMS and it’s why, today, I’ll explain to you how to create your view in OMS, for IIS servers.
I’m currently discovering Microsoft OMS and it’s why, today, I’ll explain to you how to create your view in OMS, for IIS server
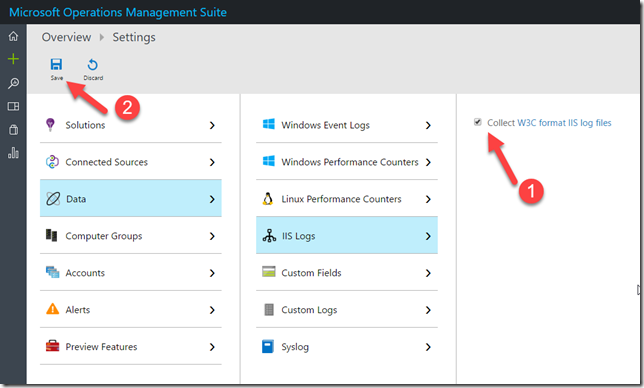
Before starting, we need to activate some rules/features in OMS. The first one is to activate the logs IIS collection. Navigate to Settings > Data > IIS Logs and check the box to activate the IIS logs (1) and Save (2):
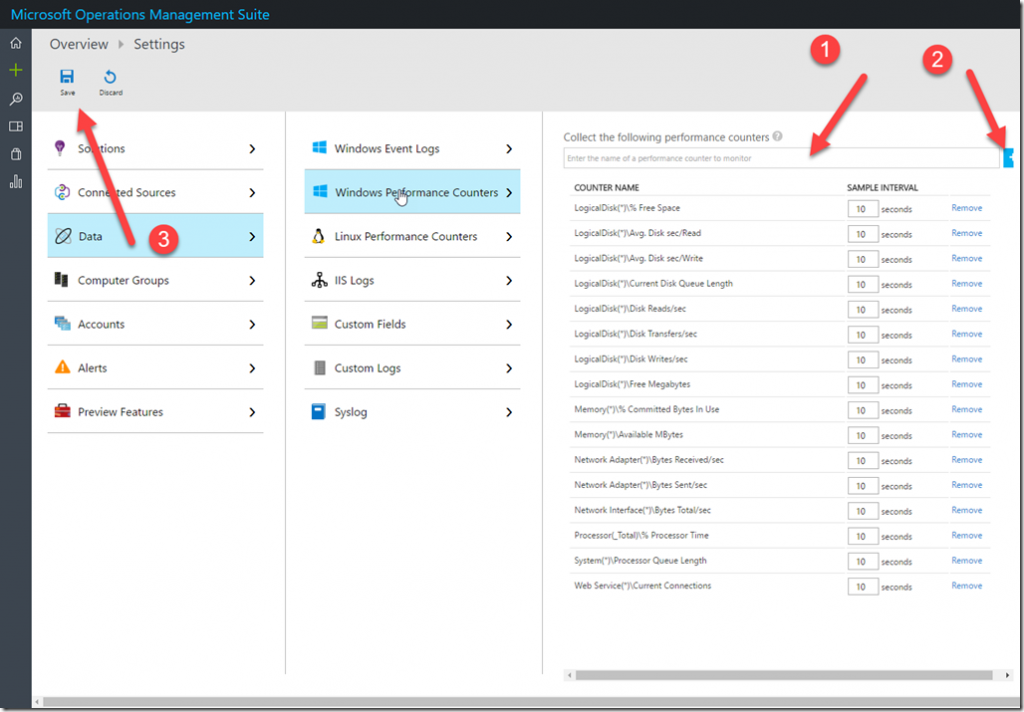
If you want to monitor the number of connection in real time, go to Settings > Data > Windows Performance Counters. Here, find Web Service(*)\Current Connections (1) then, click on the add button (2) and, finally, save (3):
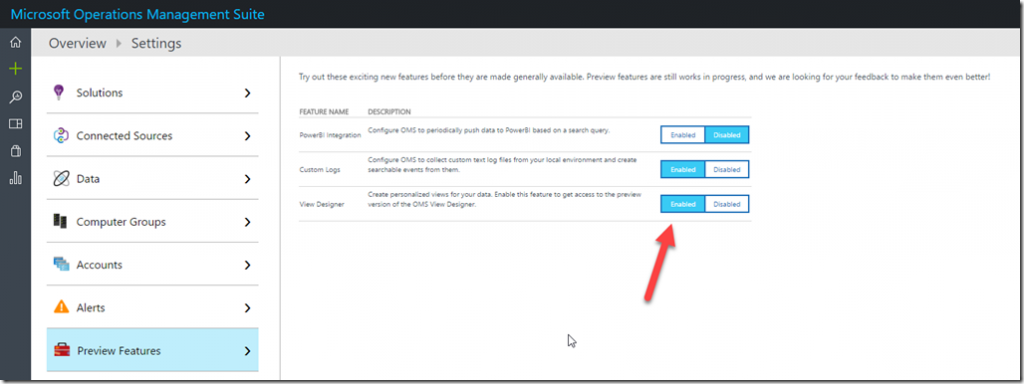
To create a personal view, you need to activate a new feature in Settings > Preview Features > View Designer and activate it:
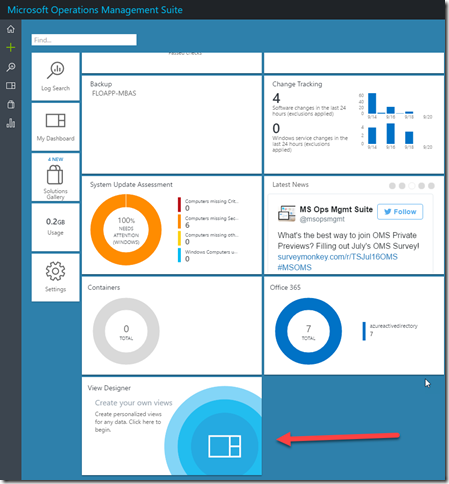
Go back on your home screen. You’ll see a new solution, View Designer:
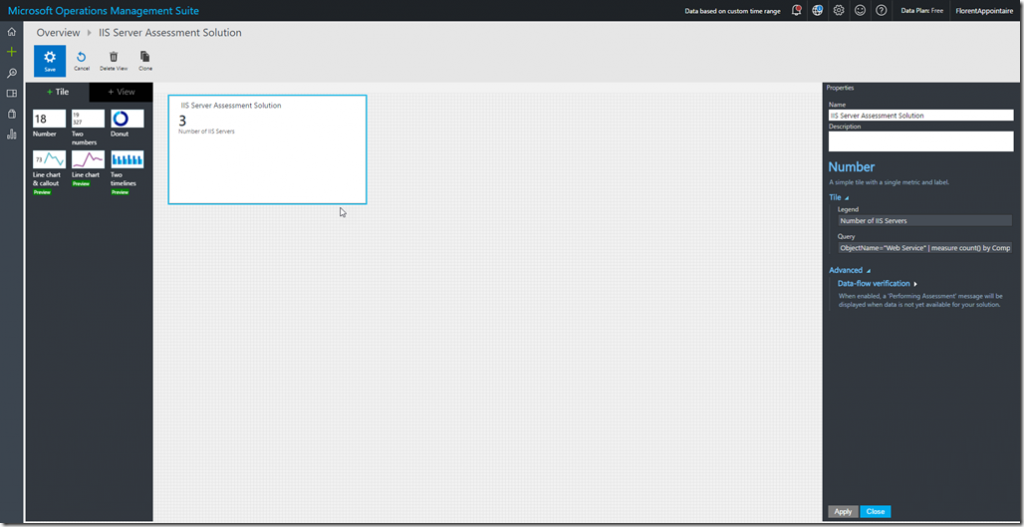
Open it to create the new solution. Choose the Tile Number then, on the right pane, fill in like this:
| Name | Text |
| Name | IIS Server Assessment Solution |
| Legend | Number of IIS Servers |
| Query | ObjectName=”Web Service” | measure count() by Computer |
This tile will show the number of IIS servers that you have in your OMS infrastructure. Don’t forget to save sometimes, by clicking on Save, on the top left.
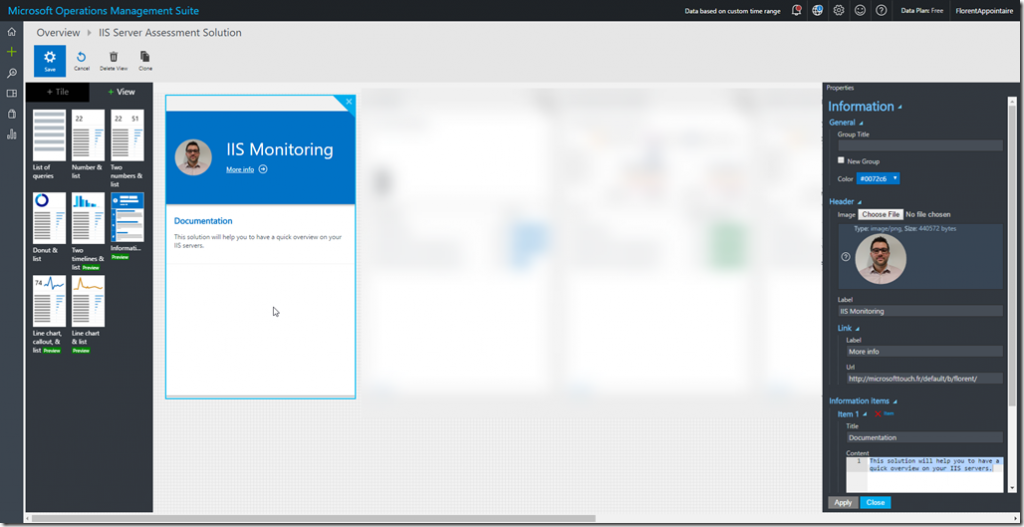
Click now on View, beside Tile. I added an information view, it’s not mandatory:
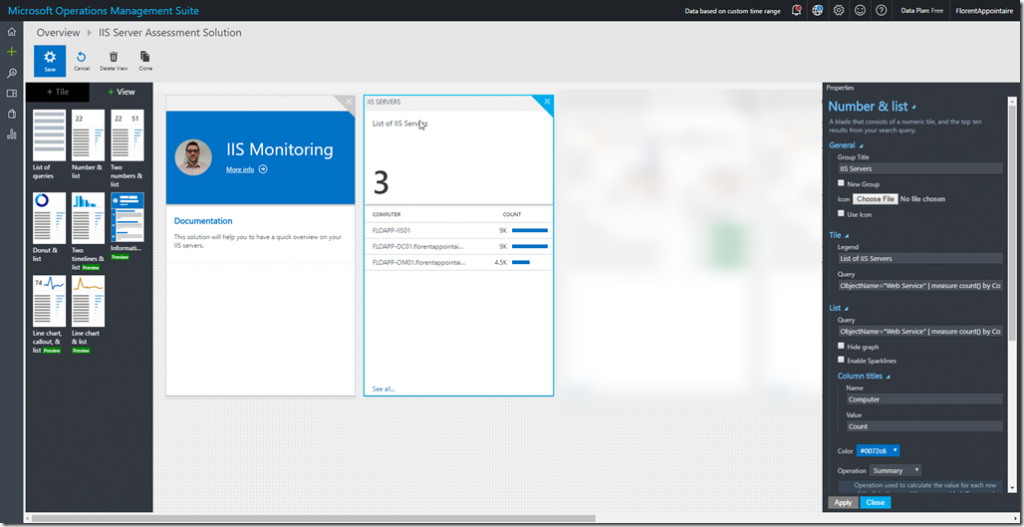
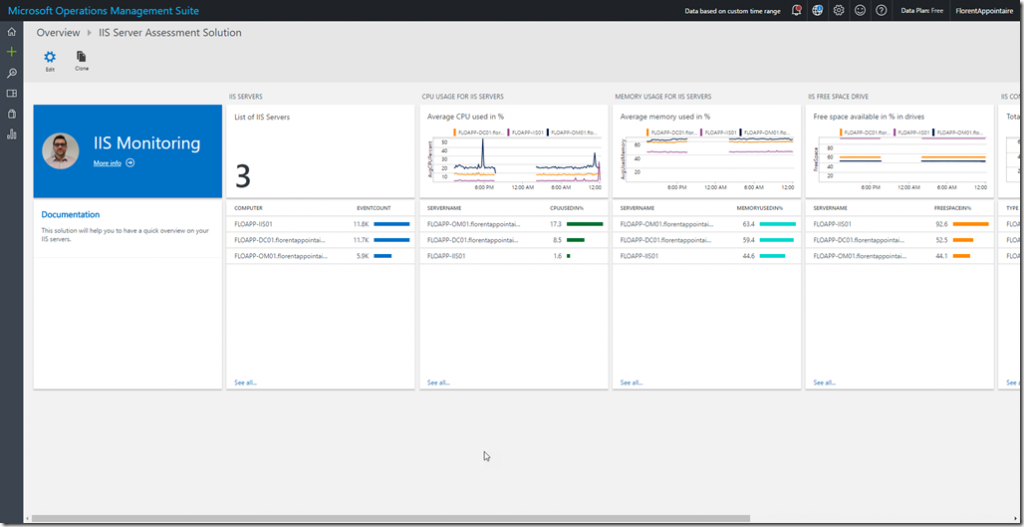
After, add a view with type Number & list. This view will show you the list of IIS servers. Fill in as following:
| Name | Text |
| Group Title | IIS Servers |
| Tile Legend | List of IIS Servers |
| Tile Query | ObjectName=”Web Service” | measure count() by Computer |
| List Query | ObjectName=”Web Service” | measure count() by Computer |
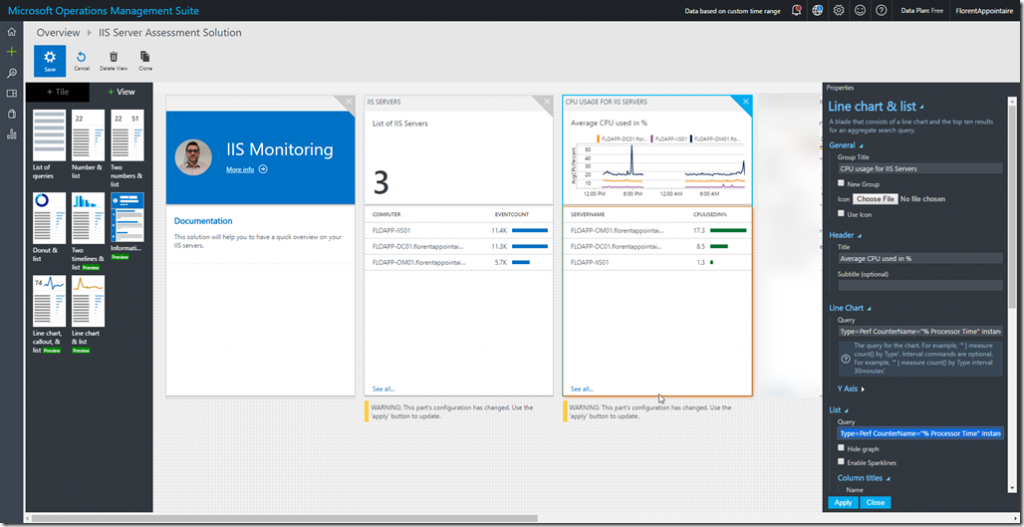
Add a new view with type Line chart & list to have the average of CPU used, on each server that as the IIS role installed. Fill in as following:
| Name | Text |
| Group Title | CPU usage for IIS Servers |
| Header Title | Average CPU used in % |
| Line Chart Query | Type=Perf CounterName=”% Processor Time” InstanceName=”_Total” Computer IN {ObjectName=”Web Service” | measure count() by Computer} | Measure Avg(CounterValue) as AvgCPUPercent by Computer interval 10minutes |
| List Query | Type=Perf CounterName=”% Processor Time” InstanceName=”_Total” Computer IN {ObjectName=”Web Service” | measure count() by Computer} | Measure avg(CounterValue) by Computer |
| Navigation query | {selected item} Type=Perf CounterName=”% Processor Time” InstanceName=”_Total” |
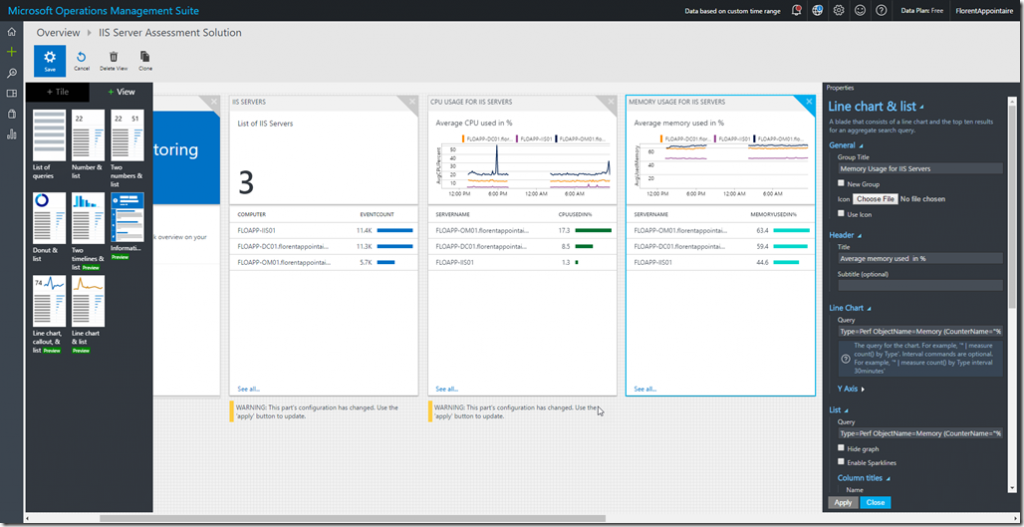
Add a new view with type Line chart & list to have the average of memory used, on each server that as the IIS role installed. Fill in as following:
| Name | Text |
| Group Title | Memory Usage for IIS Servers |
| Header Title | Average memory used in % |
| Line Chart Query | Type=Perf ObjectName=Memory (CounterName=”% Used Memory” OR CounterName=”% Committed Bytes In Use”) Computer IN { ObjectName=”Web Service” | measure count() by Computer}|Measure Avg(CounterValue) as AvgUsedMemory by Computer interval 10minutes |
| List Query | Type=Perf ObjectName=Memory (CounterName=”% Used Memory” OR CounterName=”% Committed Bytes In Use”) Computer IN { ObjectName=”Web Service” | measure count() by Computer}|Measure avg(CounterValue) by Computer |
| Navigation query | {selected item} Type=Perf ObjectName=Memory (CounterName=”% Used Memory” OR CounterName=”% Committed Bytes In Use”) |
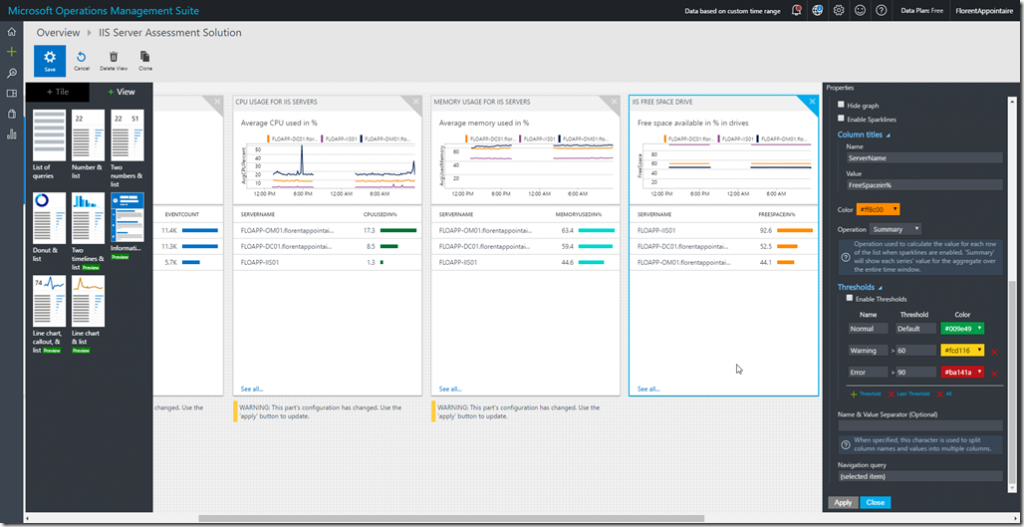
Add a new view with type Line chart & list to have the average of free disk space, on each server that as the IIS role installed. Fill in as following:
| Name | Text |
| Group Title | IIS Free Space Drive |
| Header Title | Free space available in % in drives |
| Line Chart Query | Type=Perf (CounterName=”% Free Space”) Computer IN { ObjectName=”Web Service” | measure count() by Computer}| Measure Avg(CounterValue) as FreeSpace by Computer interval 1minute |
| List Query | Type=Perf (CounterName=”% Free Space”) Computer IN { ObjectName=”Web Service” | measure count() by Computer} | measure avg(CounterValue) by Computer |
| Navigation query | {selected item} Type=Perf (CounterName=”% Free Space”) |
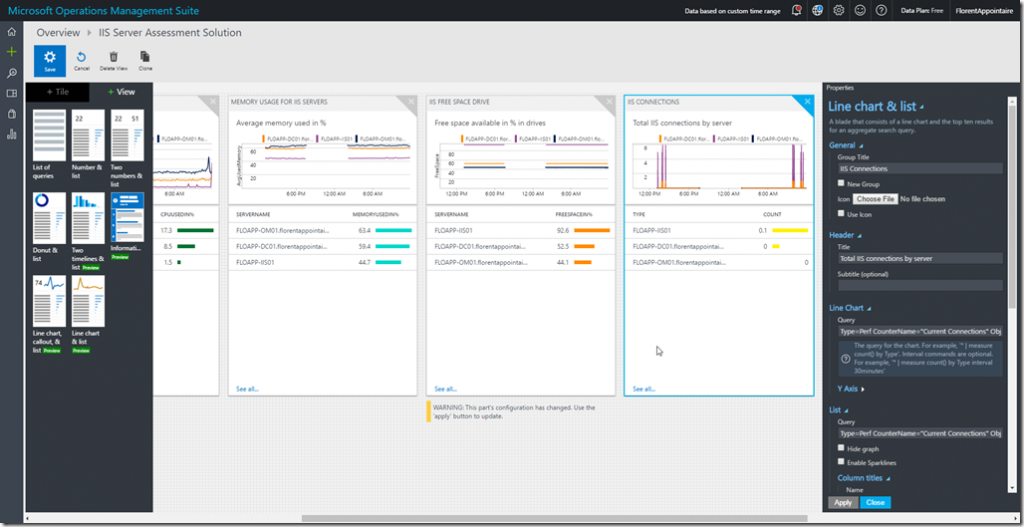
If you activated the object to get the number of IIS connection, so add a new view with type Line chart & list. Fill in as following:
| Name | Text |
| Group Title | IIS Connections |
| Header Title | Total IIS connections by server |
| Line Chart Query | Type=Perf CounterName=”Current Connections” ObjectName=”Web Service” InstanceName=_Total | measure avg(CounterValue) by Computer interval 1minute |
| List Query | Type=Perf CounterName=”Current Connections” ObjectName=”Web Service” InstanceName=_Total | measure avg(CounterValue) by Computer |
| Navigation query | {selected item} Type=Perf CounterName=”Current Connections” InstanceName=_Total |
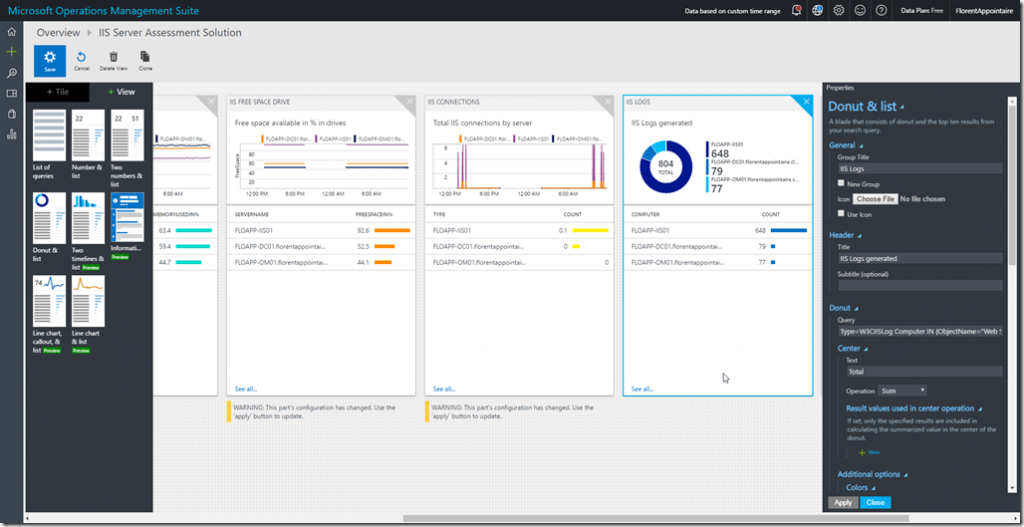
Finally, we will add a last view with type Donut & list to have an overview of events with type W3CIISLog on each server. Fill in like this:
| Name | Text |
| Group Title | IIS Logs |
| Header Title | IIS Logs generated |
| Donut Query | Type=W3CIISLog Computer IN {ObjectName=”Web Service” | measure count() by Computer} | measure count() by Computer |
| List Query | Type=W3CIISLog Computer IN {ObjectName=”Web Service” | measure count() by Computer} | measure count() by Computer |
| Navigation query | {selected item} Type=W3CIISLog |
Save with the Save button on the top left.
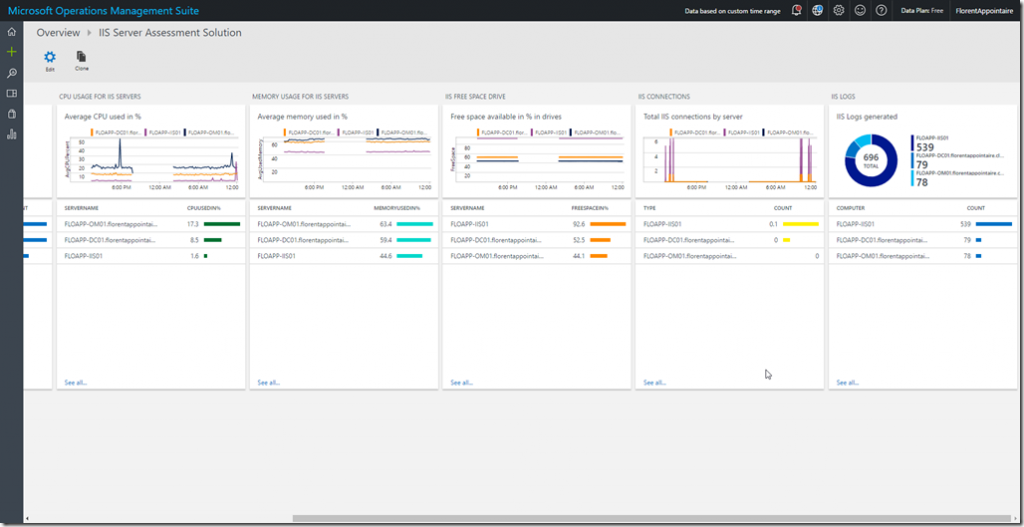
Your new view is now available and you can use it as you want
This new feature is very interesting, and, according to the uservoice of OMS, it’ll be possible soon to export your dashboard to save/transfer to other workspaces
