One big new service available (in Preview) is the possibility to stress your application, to see how your application answers to the heavy load and under stress.
You can see more information here: What is Azure Load Testing? | Microsoft Learn
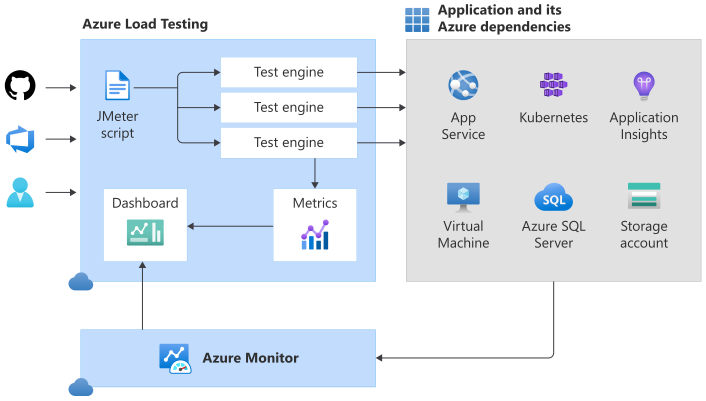
Here is the diagram provided by Microsoft:
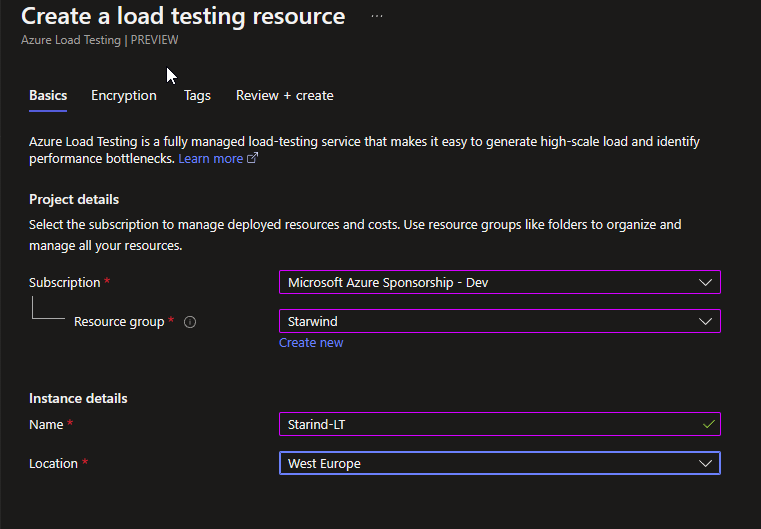
To start the use of the service, go to the Azure Portal and search for Azure Load Testing. And create a new one:
Choose your encryption type, and create it:
It takes less than a minute to deploy it:
Regarding IAM roles, you can assign the following roles:
- Load Test Owner: Can do everything
- Load Test Contributor: Can view/create/update/delete/execute load tests
- Load Test Reader: View/list load tests but cannot do any changes
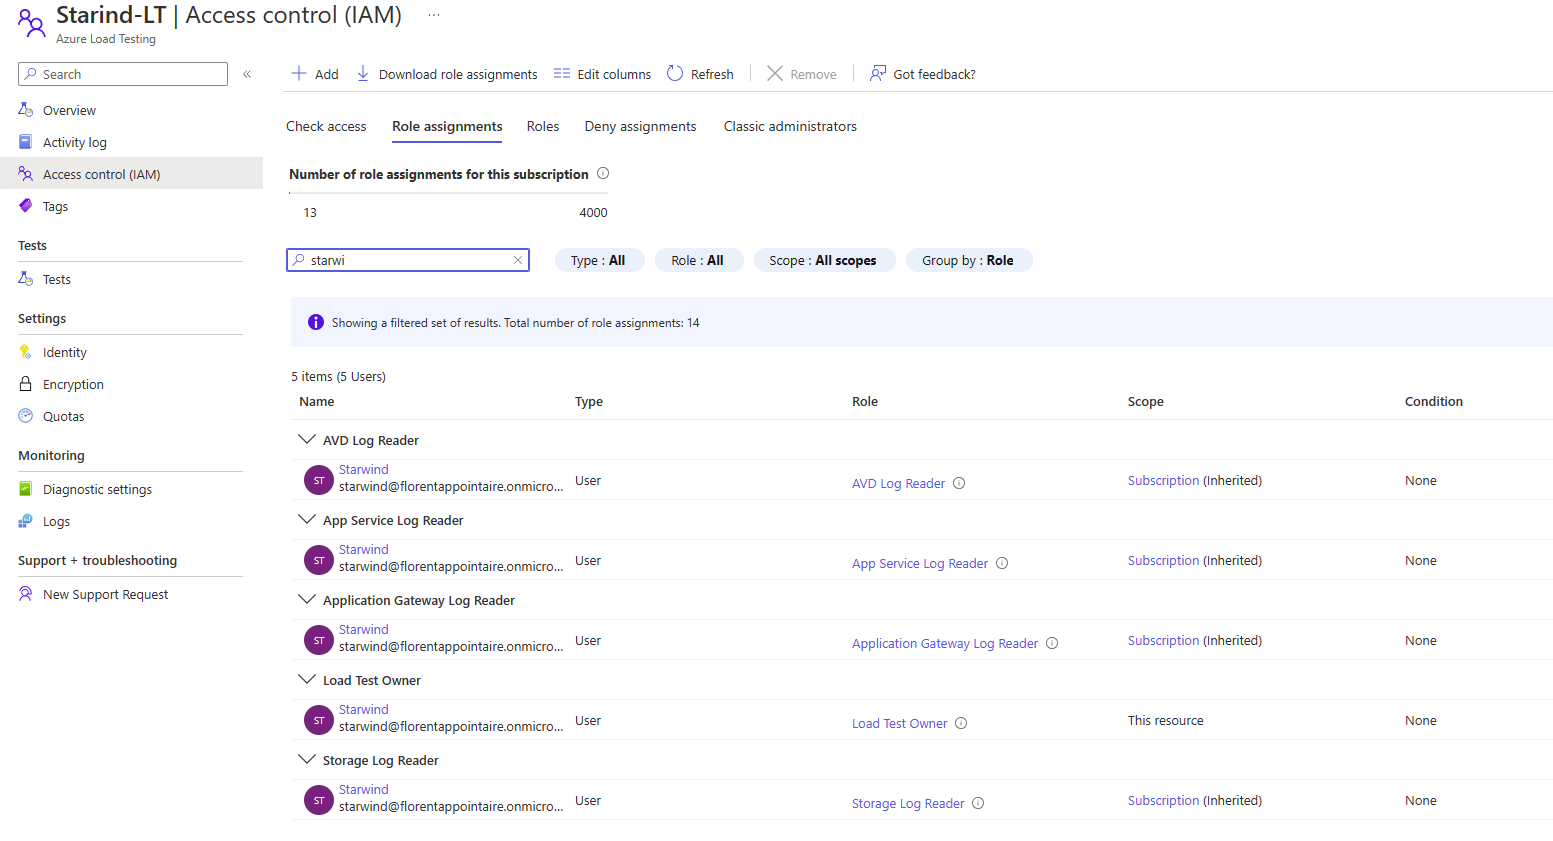
I assigned the Owner role to one of my Azure AD account:
I tried with a guest account, and I had the following error:
I don’t know why, but apparently, you can’t use this service with guest account.
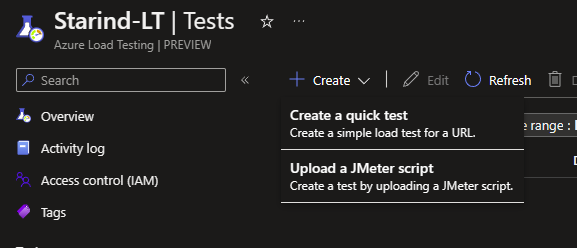
We can now do load test. 2 types of tests are available:
- Quick test
- JMeter script
We will do the quick test in this example. For the JMeter upload, you can follow this article: Apache JMeter – User’s Manual: Getting Started
We will start the quick test wizard:
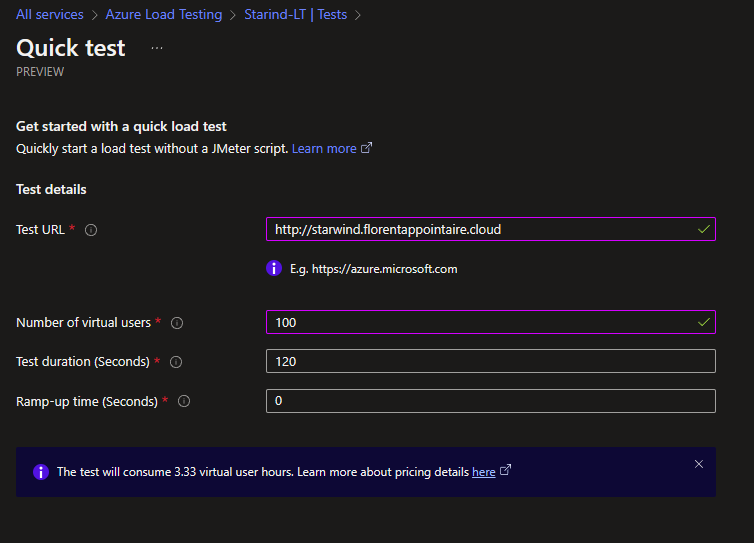
We will test this website: http://starwind.florentappointaire.cloud
Choose the number of virtual users that you want to test. Maximum 11250.
Choose the test duration in seconds.
The ramp up time in seconds.
At the end, it will estimate the cost in virtual hours, in my case, 3.33. The cost will be the following:
9.41€/month for the resource it self. It includes 50 virtual user hours. So in my case, nothing more to pay. Pricing table is available here: Azure Load Testing – Pricing | Microsoft Azure
Now, create a new quick test, with the
Click on Run test. The test is created and will start:
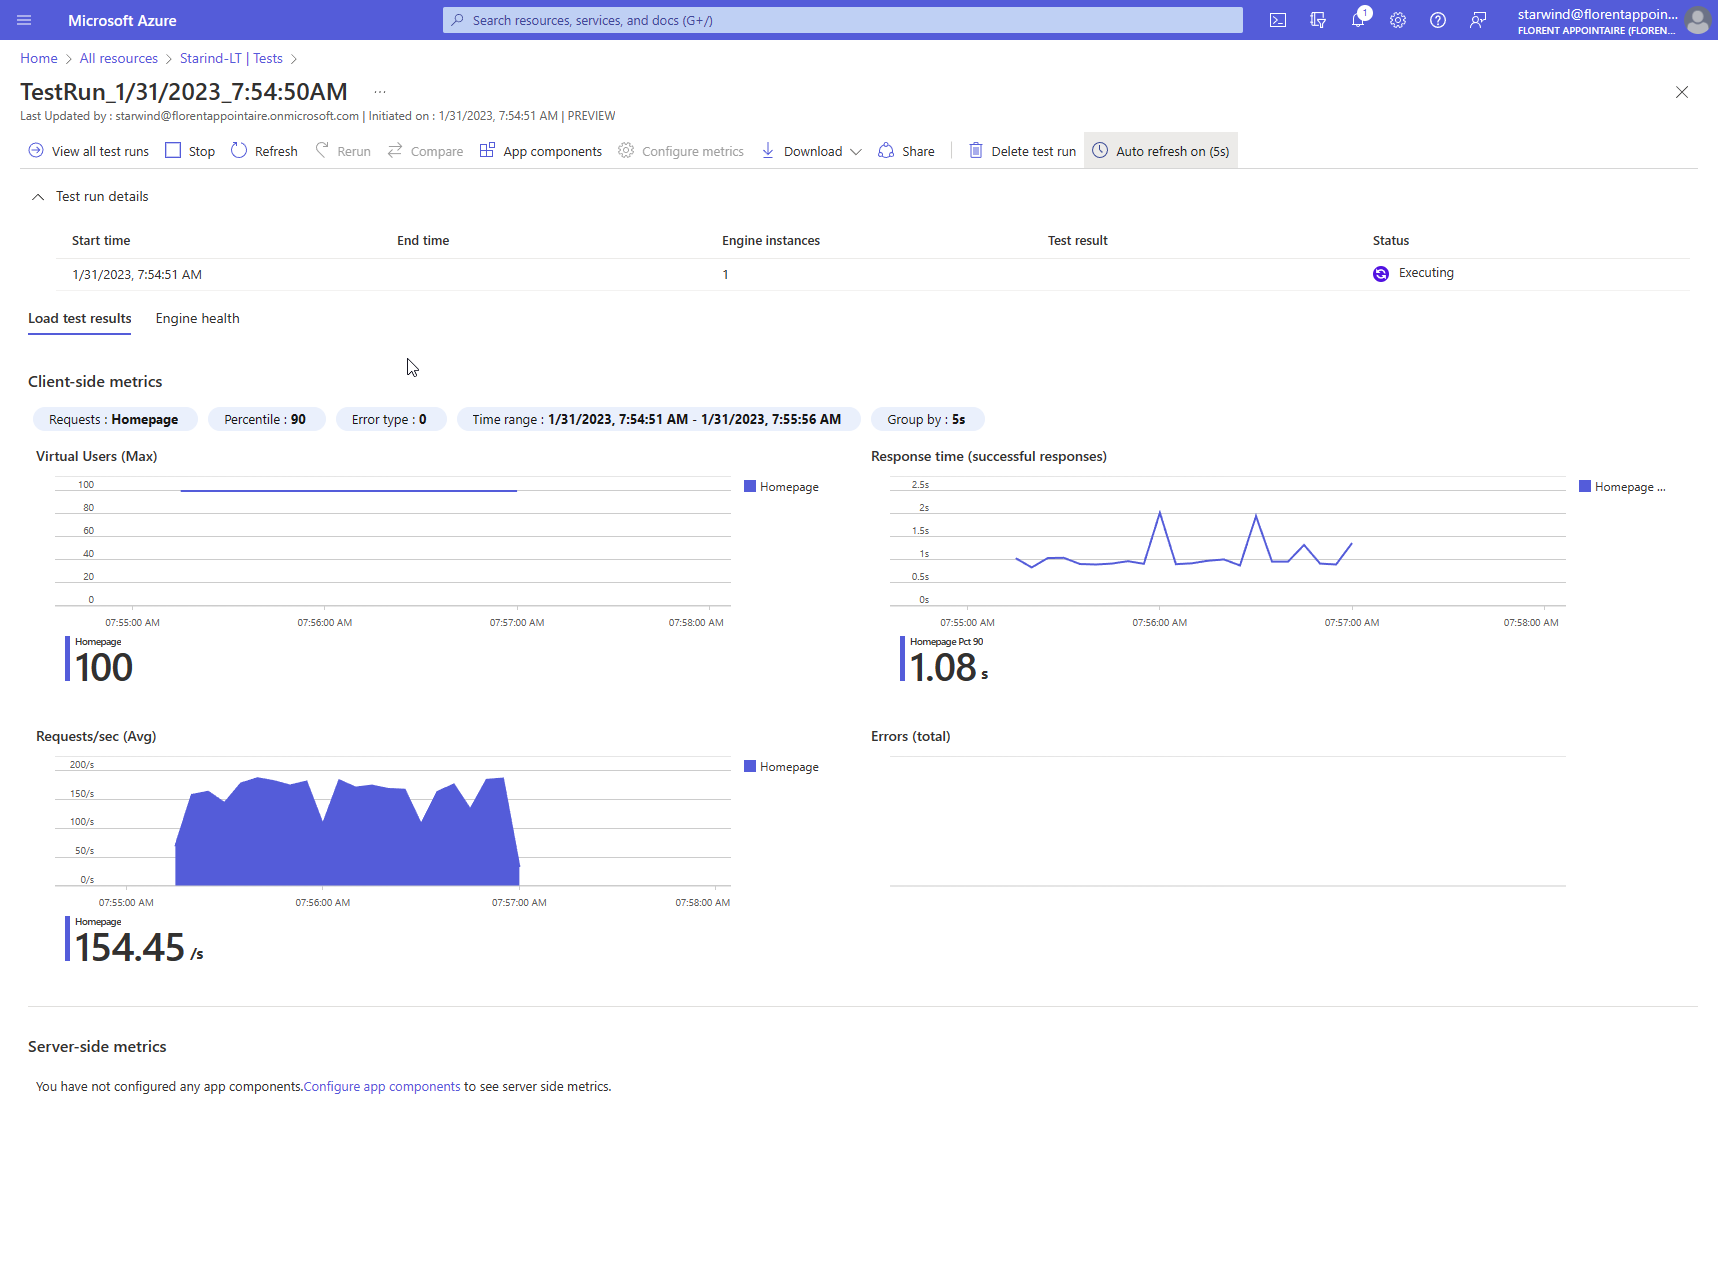
After a few seconds, the test has been started and you can find some information regarding the test, and the most important part, the response time:
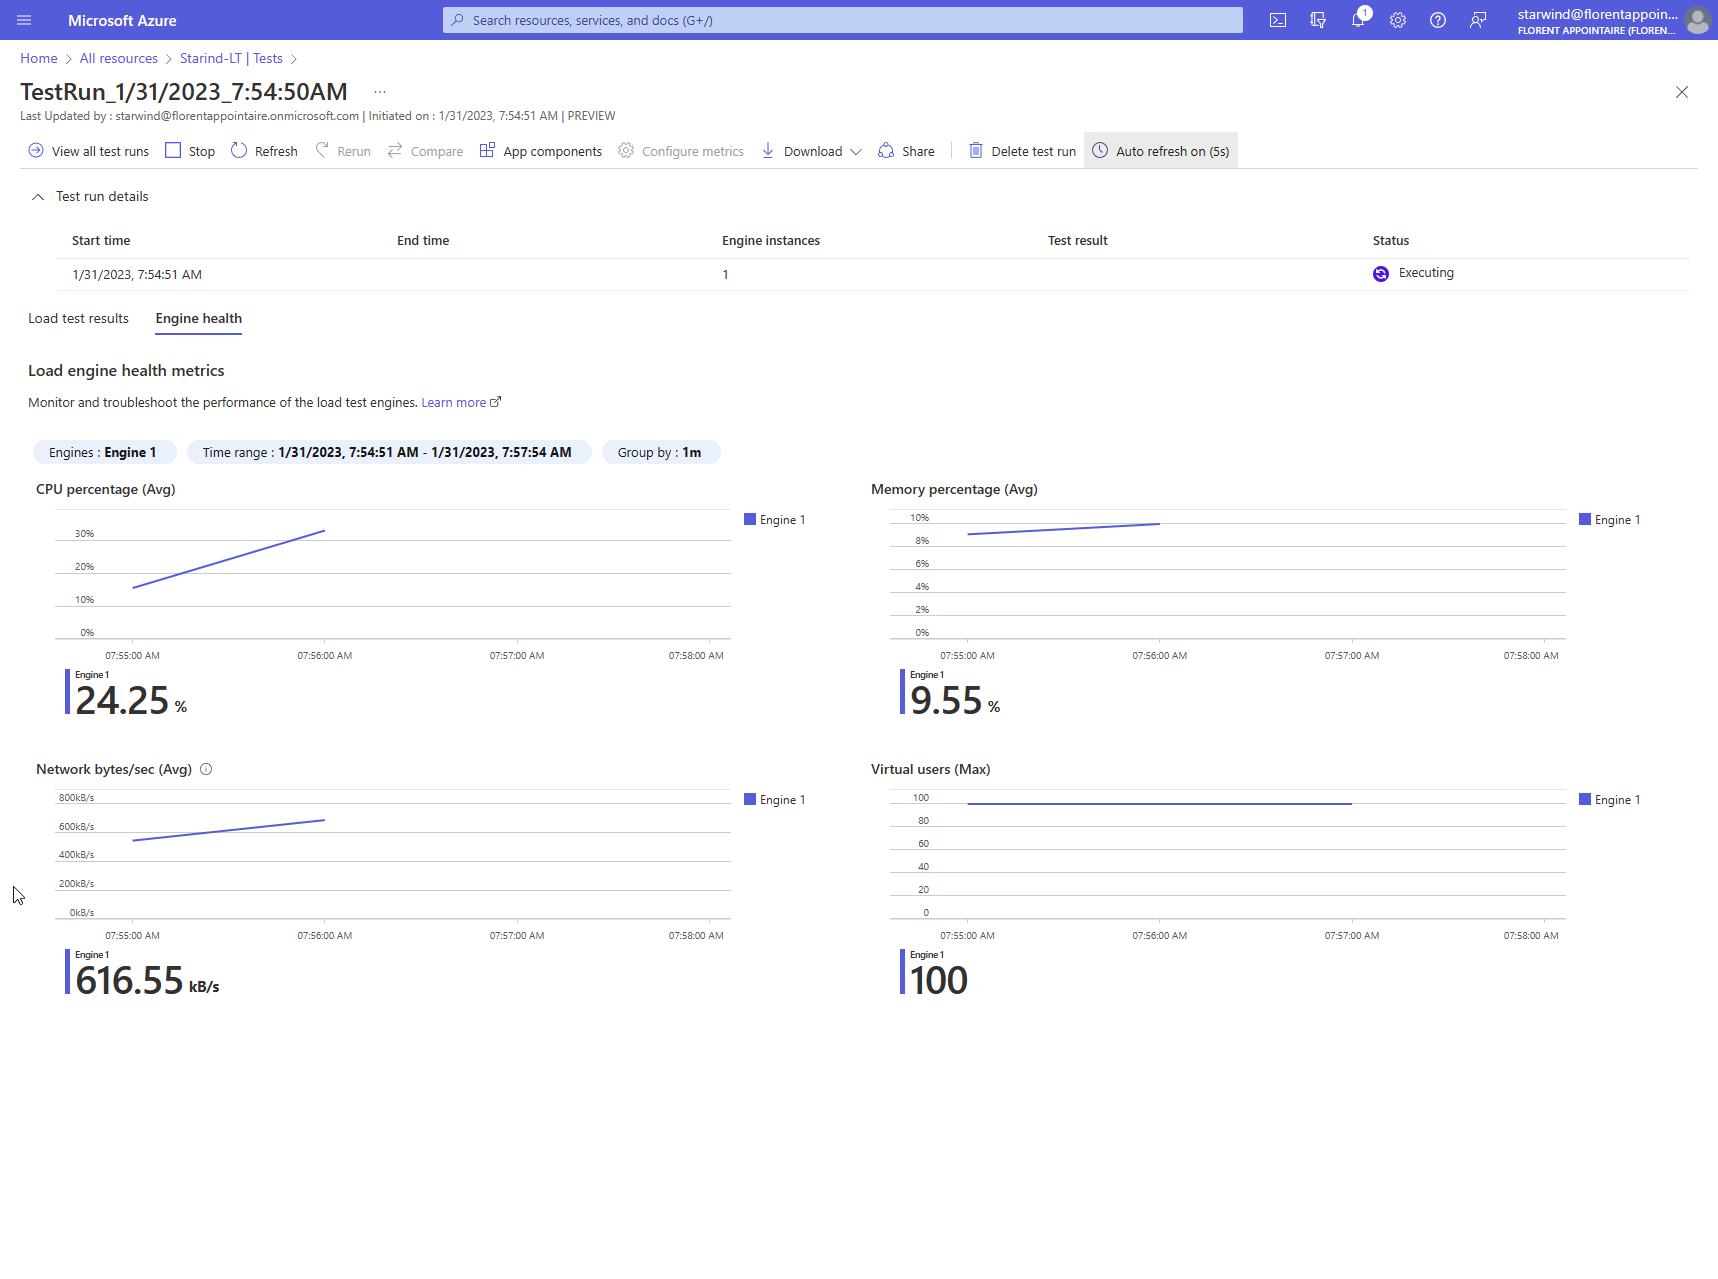
You can also see the load of the engine that runs the script:
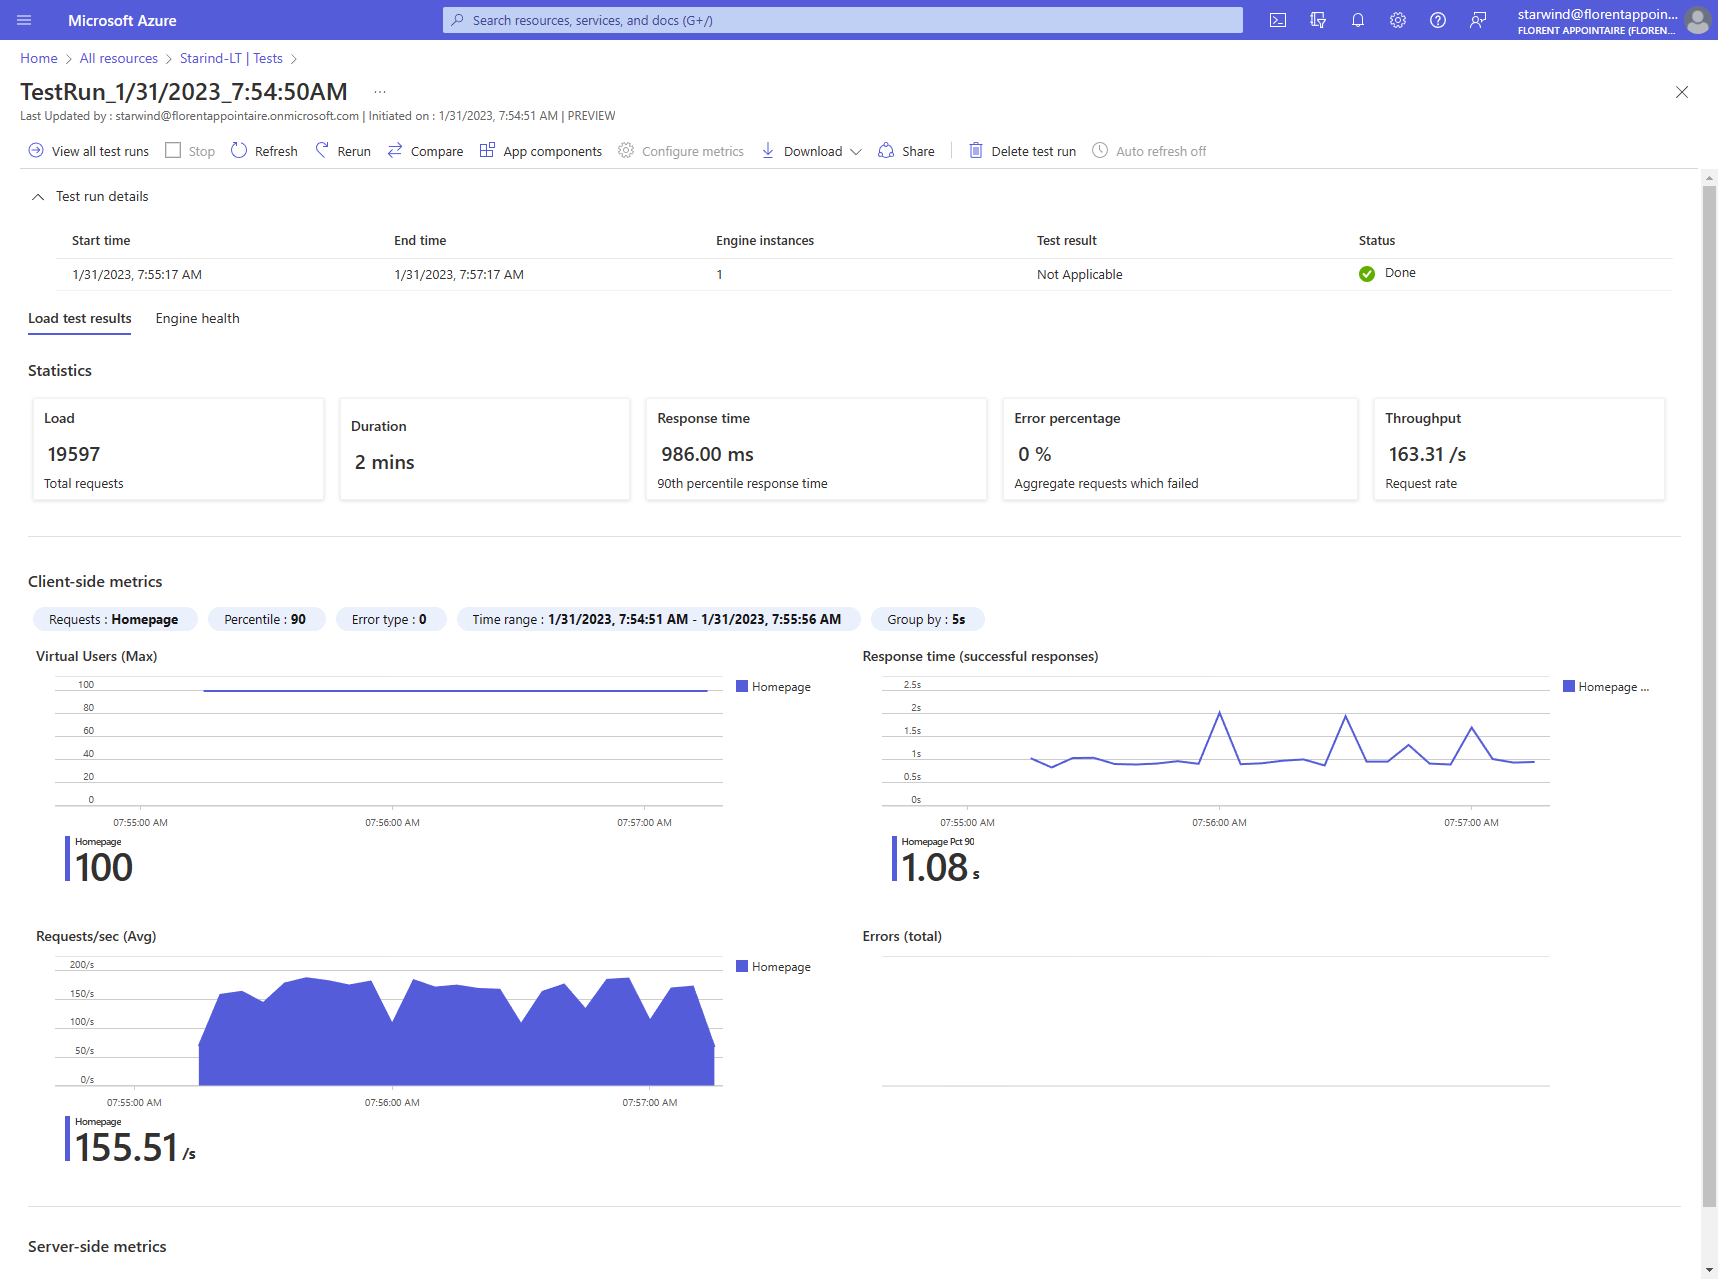
When the test is done, 120 seconds for me, you can find all information on the run page. As you can see, for 100 users, my website response time was less than a second, with 0% error and 19597 requests have been done:
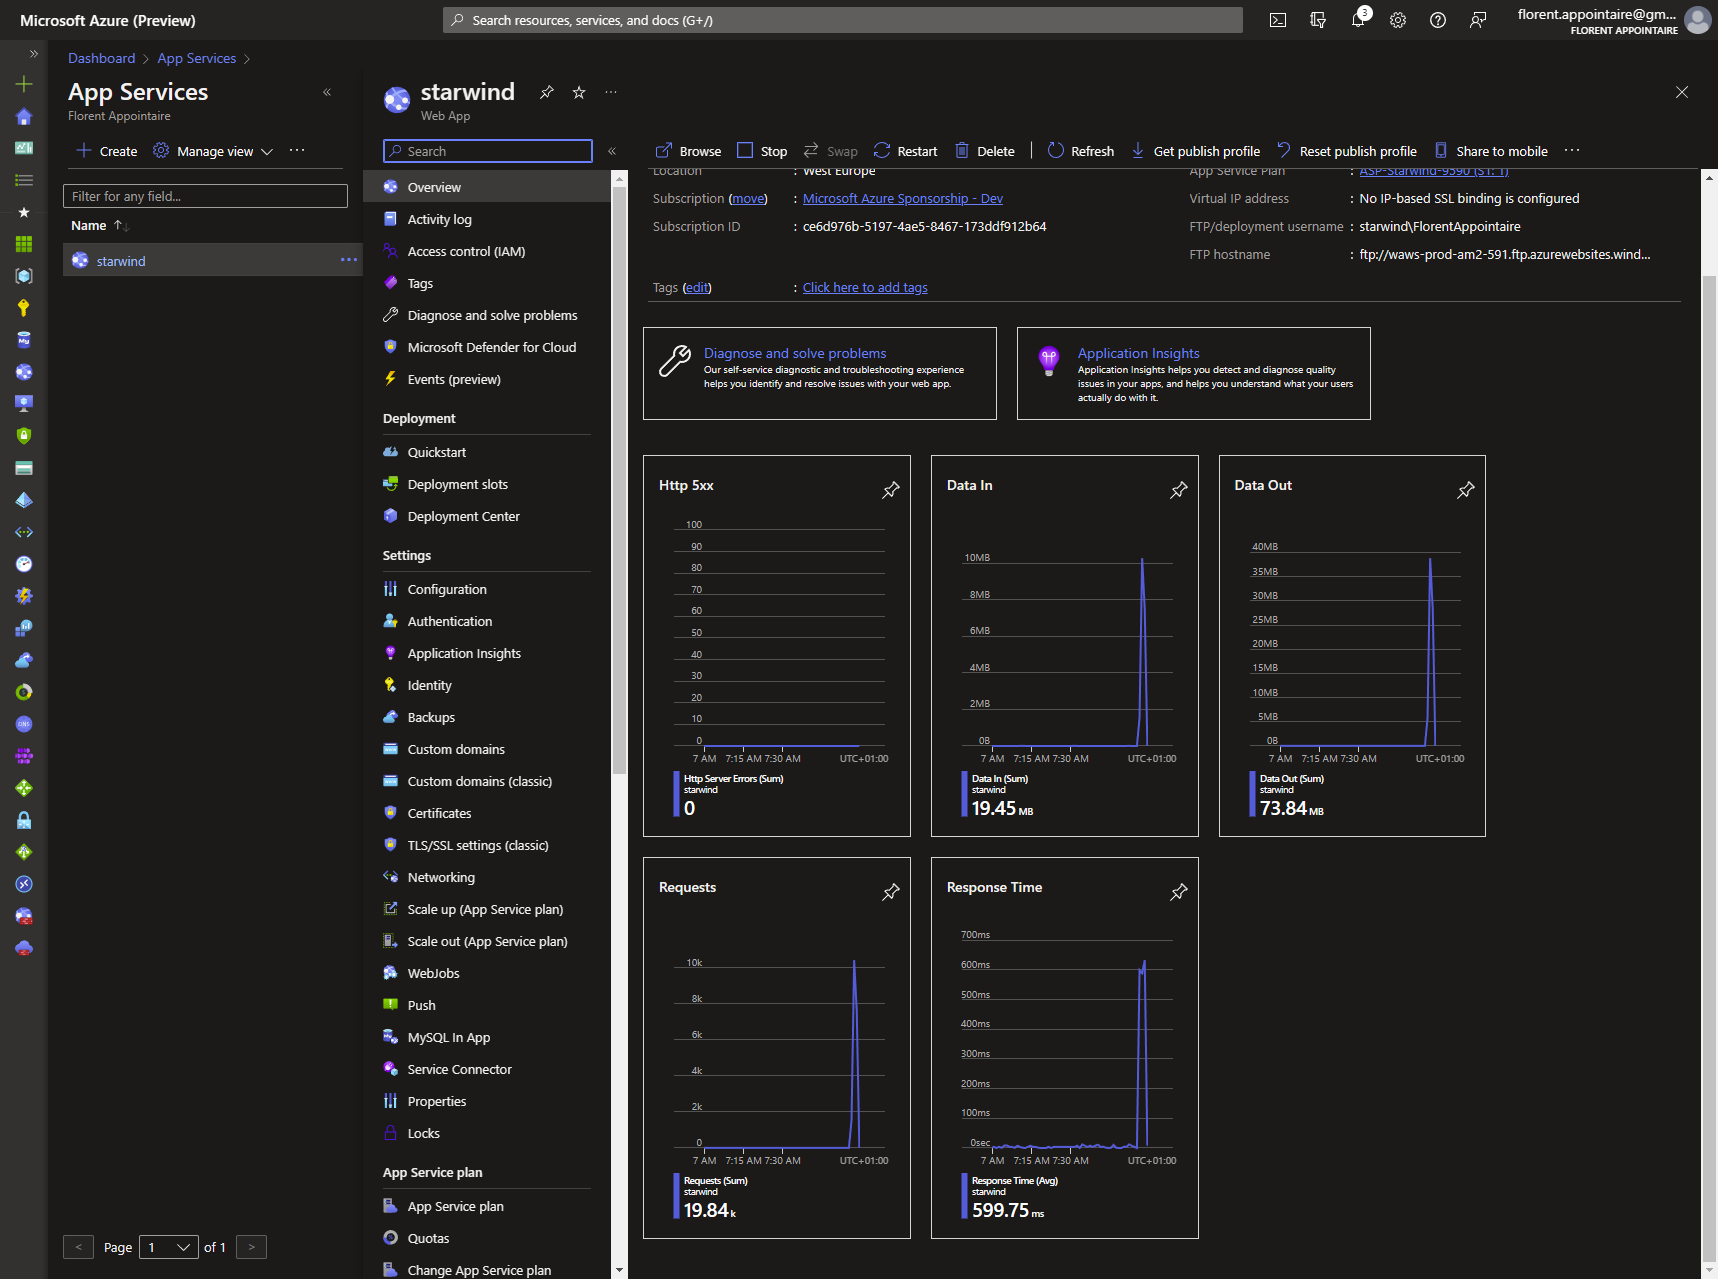
If I check the performance of the app itself, I can see the number of requests, data in/out and response time of the web app:
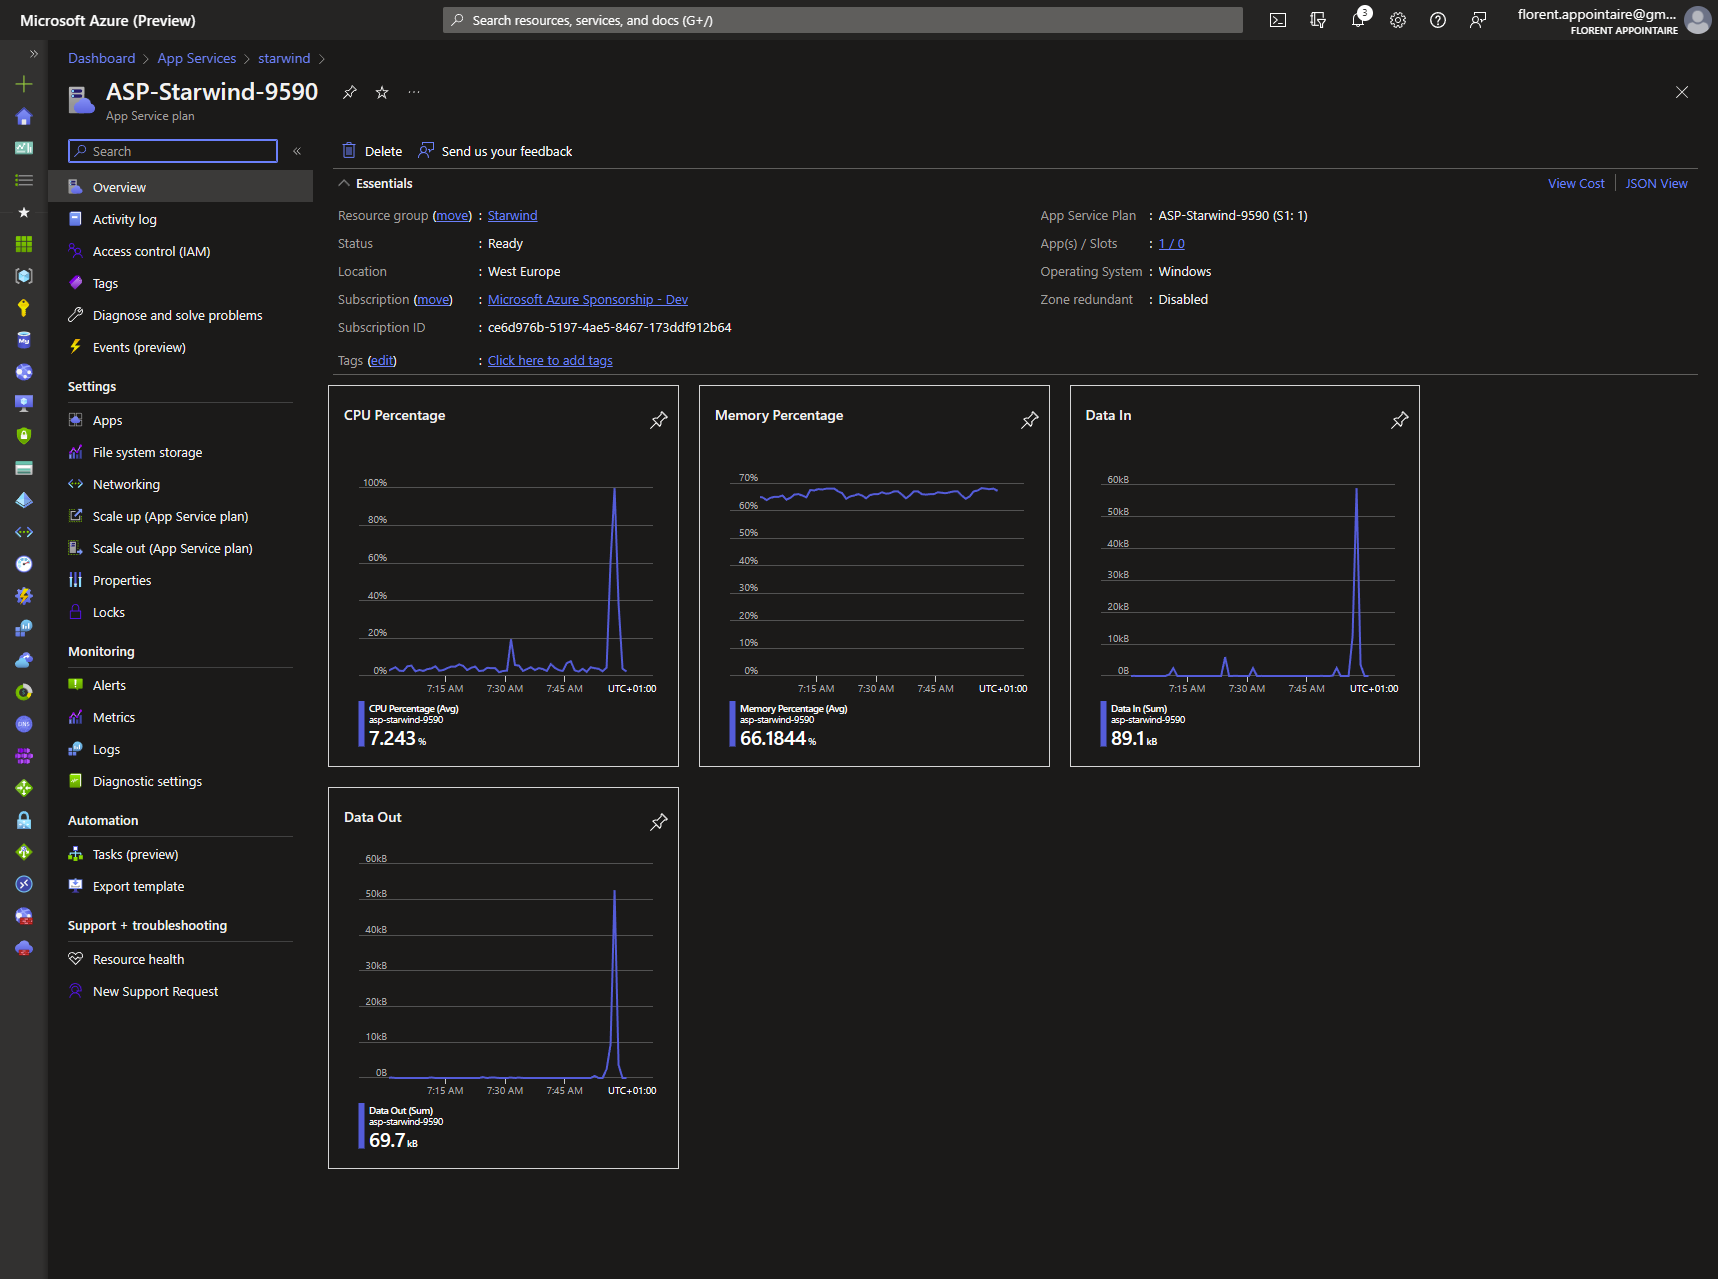
And for the app service plan, we can see that CPU took a lot of traffic 
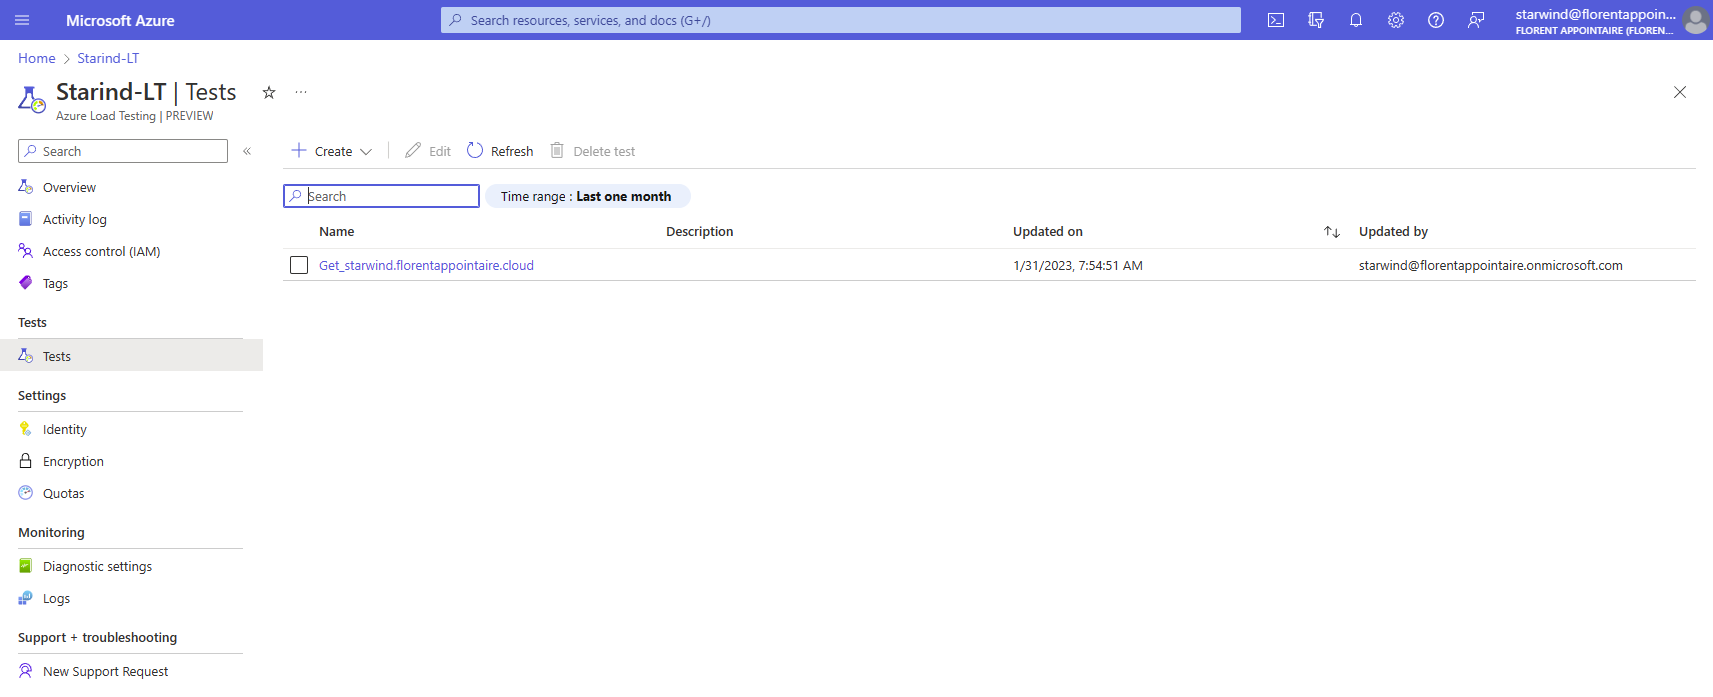
On the welcome page of the test, you can see all tests that have been executed:
This new service, currently in preview, can be very useful to test a heavy charge on your website and check the performances of your app service plan for example, to size it correctly.


