Introduction
VMware has recently updated IOBlazer on VMware Labs, one of its most useful utilities for storage benchmarking in VMware vSphere environments. The utility allows generating workloads for various storage platforms: Linux, Windows, or Mac OS. With this piece of software, we can set high-level customization of I/O patterns, which is crucial for reliable testing of storage subsystems from inside virtual machines. In this article, I’m going to investigate IOBlazer testing capabilities and share my hands-on experience.
Quick recap
The utility was published back in 2011, and no updates were released ever since. However, in the summer of 2019, version 1.01 appeared; application seems to be alive and kicking again.
For storage administrators, the utility’s main feature of interest is an ability to carefully customize inside a virtual machine the following workload settings:
- I/O size and workload pattern
- Burstiness, i.e., the number of outstanding IOs
- Burst interarrival time
- Read vs. write mix
- Buffered vs. direct I/O
IOBlazer evolved from a minimalistic MS SQL Server emulator, which had been initially focused solely on emulating MS SQL Server I/O workloads (Asynchronous, Un-buffered, Gather/Scatter), to a must-have benchmark tool. Its new version functionality is way better, but two limitations are persistent:
- The alignment of memory access on 4K boundaries (i.e., a memory page)
- The alignment of disk access on 512B boundaries (i.e., a disk sector)
It should be noted that IOBlazer is used for testing the storage subsystem inside a virtual machine, allowing you to check such important metrics as latency, IOPS, and throughput right within the virtualization layer. In such a way, you’ll get the most reliable numbers for application performance. These metrics impact performance of applications running inside guest VMs.
Let’s briefly overview what each of these metrics means.
IOPS (input/output operations per second)
The number of IOPS that a system can deliver depends on hardware, network components, and architecture of the system on the whole. During testing, this metric correlates with latency since when the I/O size is increased, the number of delivered IOPS drops and latency rises.
Latency
The latency is usually measured in milliseconds, showing the time an application needs to perform an I/O. There are no conventional “good” numbers for this metric; they have to be discovered by trial and error by how satisfied the users are.
Latency depends on the following factors: I/O block size, read/write ratio, simultaneous I/Os.
Throughput
Throughput is vital while performing large I/O and read/write patterns (i.e., sequential/random). The larger the I/O, the bigger the throughput. In terms of data transfer, one 256K I/O operation equals 64 I/Os of 4К. However, in terms of throughput, performance for each case are going to differ considerably because they take up different amounts of time.
Using the utility
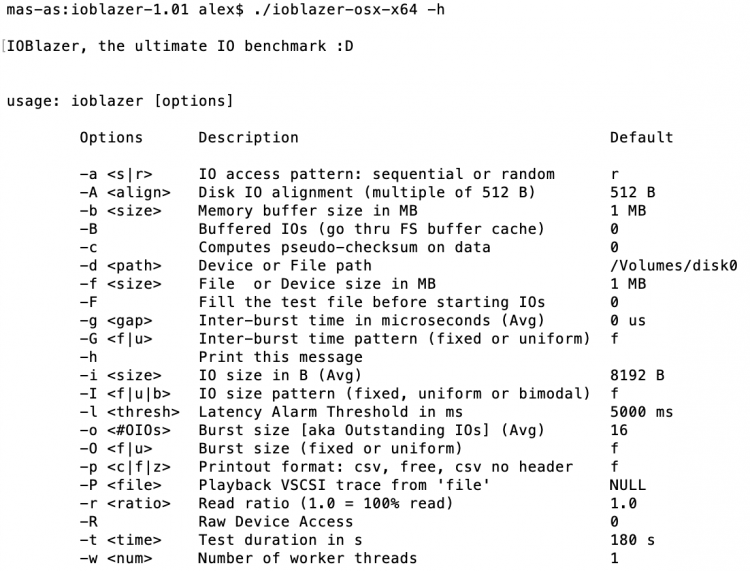
To start the utility, you must download it from VMware Labs and launch it (no installation required). You can run IOBlazer with the -h key to find out the available options to identify the workload pattern.
FYI: Settings have their own default values. If you’re okay with them, you don’t need to change anything.
Setting up
Let’s review the main parameters that allow you to customize the storage testing and set the workload pattern:
- -a sets the I/O pattern: random or sequential. The system processes sequential patterns operations faster than random ones. Storage arrays behave differently under these two workload types. Enterprise storage processes random operations better than cheap, while their speed of sequential operations may be relatively the same.
- -b defines the size of memory buffer, which will function as a source for writes or a target for reads.
- -B controls whether I/O operations will be buffered on the file system level or will be transferred directly to the storage.
- -c: if set, pseudo-checksum is calculated before writing to disk or after reading from it. This pattern emulates the heavy workload when data transfers are running through CPU cash.
- -d specifies the device that should be tested (bare-metal tests) or the route to a file that is being created (filesystem-level test). For example, if you’re using Windows, the file access should be set as <drive>:\path\to\file, the disk access should be set as \\.\PhisicalDrive<x>, where x is the label of the device, e.g., PhysicalDrive1.
- -f defines the size of the file or RAW volume part which are going to be tested.
- -F fills the test file with random data before initiating the I/O operation (the file is not filled by default).
- -g sets the burst inter-arrival time in milliseconds. It refers to average time if the -G option sets the proportional inter-arrival time.
- -G defines whether burst inter-arrival time will be fixed or uniformly distributed with an average time indicated in the previous option (-g).
- -i indicates the I/O size in bytes. This parameter refers to an average I/O size if option -I (capital i) sets the uniform distribution.
- -l (capital i) defines whether the size of the I/O operation will be fixed or uniformly distributed with a mean size indicated by the -i parameter. -I (capital i) can be set based on the bimodal distribution; the following modes are available: 8KB (both reads and writes), 128 KB for writes and 1MB for reads. The probability of larger I/O erupting in this case is 1%. These workloads are typical for MS SQL Server; that’s how it works with storage. Subsequently, it’s better to use patterns with bimodal distribution to estimate Microsoft SQL Server performance accurately.
- -I (small L) sets the latency threshold in milliseconds. It triggers the alert if the latency of the lastly processed I/O goes beyond this threshold.
- -o indicates the burst size, i.e., specifies the maximum queue depth. This parameter is also referred to as a number of outstanding IO. This size refers to an average value if the -O option is set to uniform distribution.
- -O defines whether burst size will be fixed or comply with a law of uniform distribution.
- -p sets the results output.
ο Free format – output in the command-line fashion
ο Comma Separated Values (CSV) – convenient output for post-processing in Excel
ο CSV without a header – adding results to files that contain the data about previous launches.
- -P enables to start the trace-file of vscsiStats utility (see below).
- -r determines the portion of reads in the I/O (e.g., 0.5 = 50%).
- -R enables to read the data directly from the device (raw device access).
- -t sets duration of the test in second.
- -w determines the number of workers, each is launched in a different thread. Each thread performs I/O independently from others and into its own file or device.
Testing
IOBlazer provides the widest range of functionality for configuring workloads for testing in close-to-real conditions. Let’s take a closer look at several ways to use this utility.
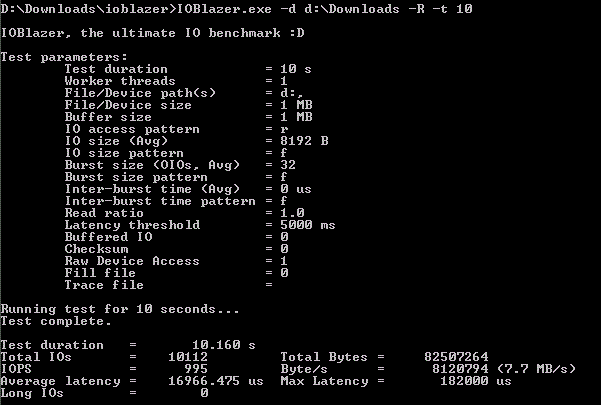
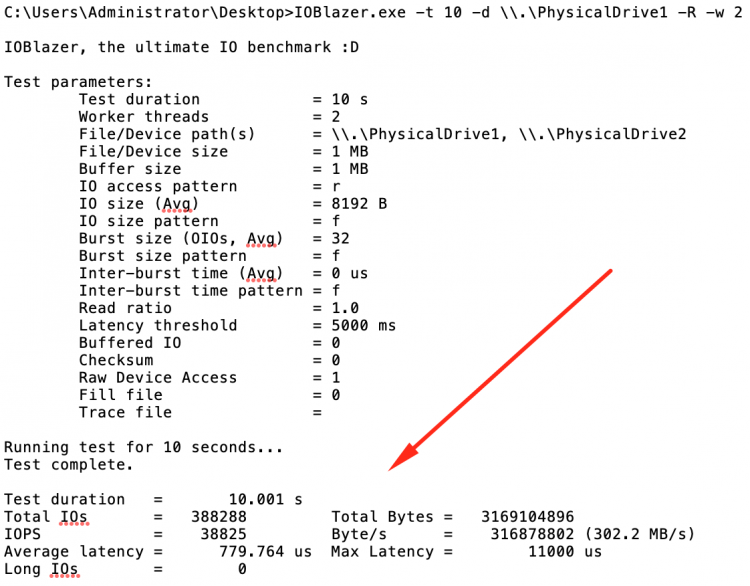
1. Launch IOBlazer for Windows and conduct the test for 10 seconds with default settings and 2 workers (e.g., devices): \\.\PhysicalDrive1 and \\.\PhysicalDrive2.
C:\Users\Administrator\Desktop>IOBlazer.exe -t 10 -d \\.\PhysicalDrive1 -R -w 2Here’s what the command returns:
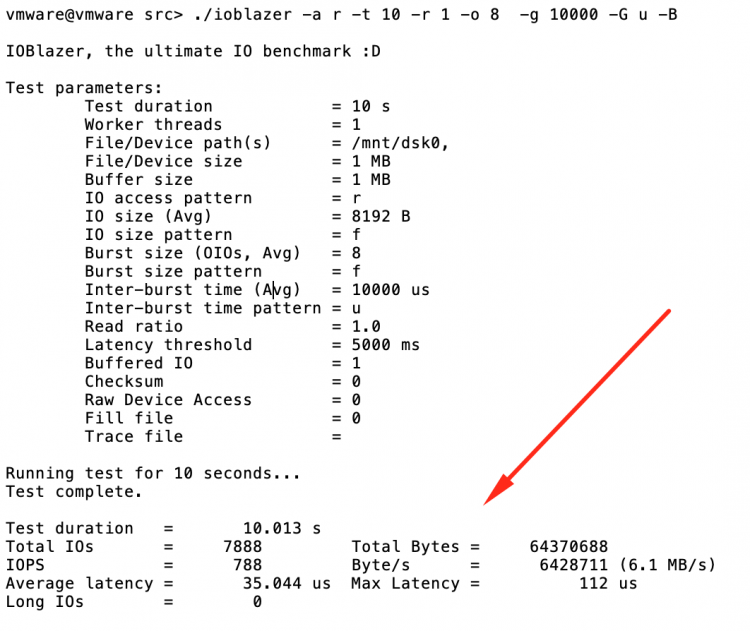
 2. Launch the utility on Linux and buffer the I/O into a test file. For this experiment, we generate the burst of 8 reading operations with an average inter-arrival time of 10 seconds.
vmware@vmware src> ./ioblazer -a r -t 10 -r 1 -o 8 -g 10000 -G u -BHere are the results:
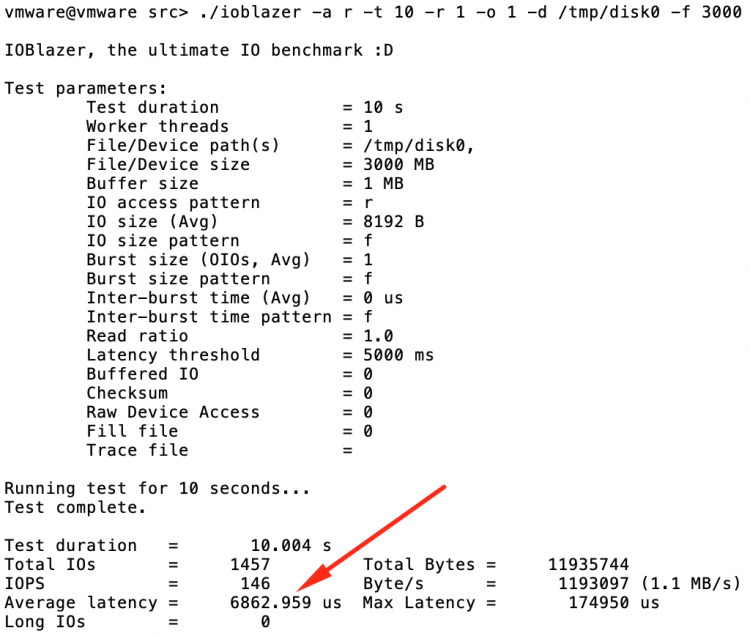
3. For the third test, we ran IOBlazer on MacOS to measure the drive read latency. For this purpose, we set the utility to perform the definite number of unbuffered random reads. Here’s the command that we use to run the utility:
vmware@vmware src> ./ioblazer -a r -t 10 -r 1 -o 1 -d /tmp/disk0 -f 3000Here are the results:
IOBlazer also features “playback” of VSCSI logs received with the vscsiStats utility. It is quite an old instrument (released back in 2009) for working with storage. It enables to measure the performance in IOPS, MBps, and I/O latency.
If you used vscsiStats to generate the trace file (trc-file), you could use the following command to “playback” it:
vmware@vmware src> ./ioblazer -P exchange.trcWorkload and test patterns will be sourced from the trace file while the command line settings will stay ignored. The result will be reflected in a standard IOBlazer output.
In a nutshell
IOBlazer enables to generate reproducible synthetic workloads on virtual disks which align to real ones, providing a room for testing. For example, an administrator can change the settings or the hardware and observe how this alters the performance by “playbacks” the workload written with vscsiStats. The performance values collected from these experiments help to fine-tune both hardware and software configurations in a way that ensures the optimum number of IOPS, latency, and throughput.
