Of all administrators planning a deployment of a fault-tolerant VMware vSAN cluster, only a few know of HCIBench, a utility for conducting automated testing of HCI infrastructure performance.
If you are wondering why you have to test vSAN cluster performance at all, here are several reasons:
- Testing and understanding storage infrastructure performance limits and making sure the cluster components are working as expected.
- Getting the reference to estimate performance changes after significant changes in vSAN architectures.
- Deriving performance baseline.
- Validation of vSAN cluster design in terms of User Acceptance Testing (UAT)
- Executing Proof of Concept (PoC) projects before moving them to production.
What HCIBench is?
Hyper-converged Infrastructure Benchmark (HCIBench) has emerged as an automation wrapper around VDbench and fio (actually, fio was added later), popular open-source benchmark tool providing means for automated testing across hyperconverged clusters. HCIBench can be used for testing not only VMware vSAN but also any other hyperconverged infrastructure storage solution in vSphere environments, such as StarWind. The utility is available on the site of VMware Labs, the project where engineers working in small groups present various useful tools for managing infrastructure.
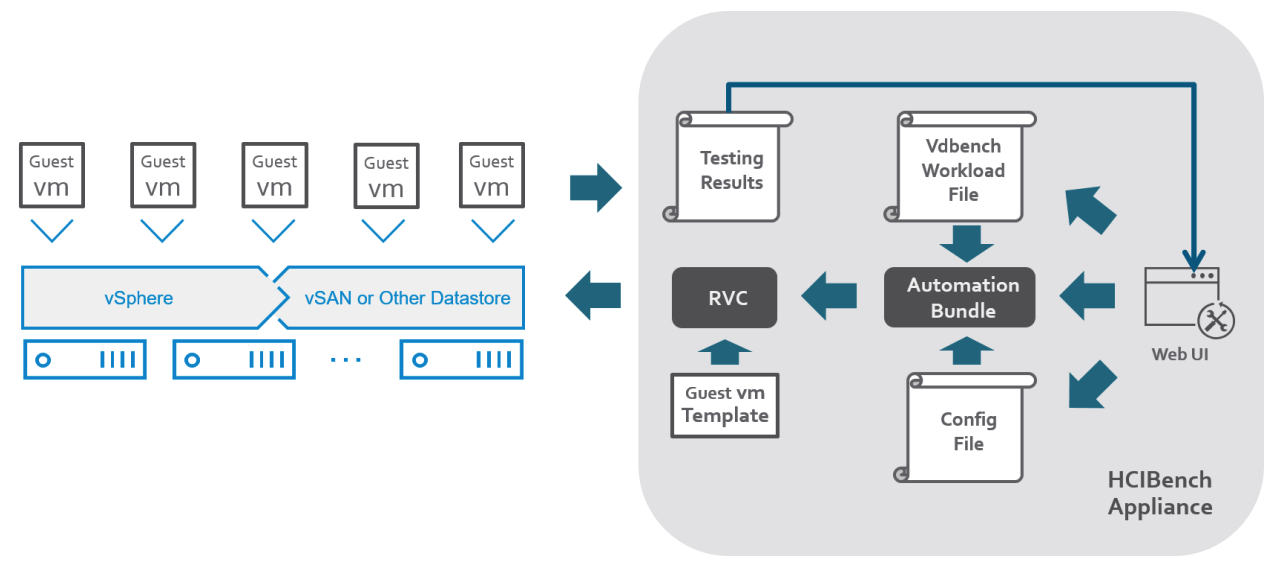
HCIbench consists of two elements:
- Controller VM that has Ruby vSphere Console (RVC), Virtual SAN Observer utility, automation bundle and configuration files installed.
- Test Linux VM deployed as a template. It allows for generating workloads.
Lately, the HCIBench utility has been updated to the versions 2.1 and 2.0. Let us take a look at how the basic functions of this utility were expanded.
- Fio (Flexible I/O) was added as a workload generator.
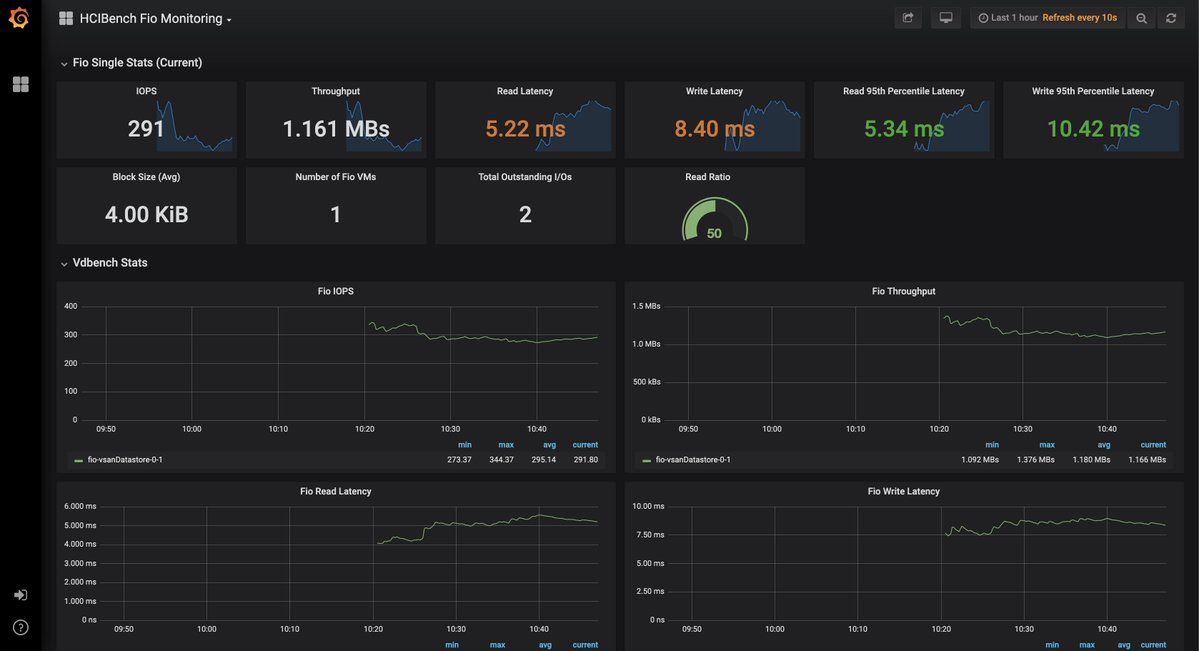
- Added support for Grafana, a solution for real-time load monitoring and visualization.
- User interface built on the Clarity UI framework just like other VMware products (e.g., vSphere Client HTML5 Web Client).
- Added 4 testing options for Easy Run.
- Dark theme.
- Redesigned VMDK preparation methodology, completing with more speed thanks to using RANDOM on deduped storage.
You can start HCIBench just by pressing a button: all you need to do is just set the script parameters. The utility takes care of the rest, sending VDbench a command on what actions to perform in a storage cluster.
HCIBench also is capable of synthetic testing of the storage cluster. Synthetic testing means that the workload is distributed between multiple virtual machines (VMs) running on different ESXi hosts. I/O operations are generated simultaneously from different VMs according to predefined I/O patterns.
How to use the utility
Now, let’s see how the tests can be carried out by setting options manually or automatically, with or without Easy Run.
Running test manually
NOTE: To measure baseline performance correctly, you need to shut down all the background processes like data deduplication, compression, or vSAN cluster-level encryption. You can enable these features afterward to see how they alter storage performance.
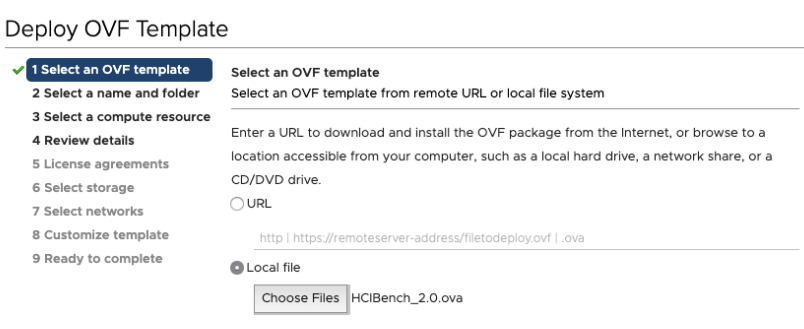
First, deploy the controller VM from the OVF template.
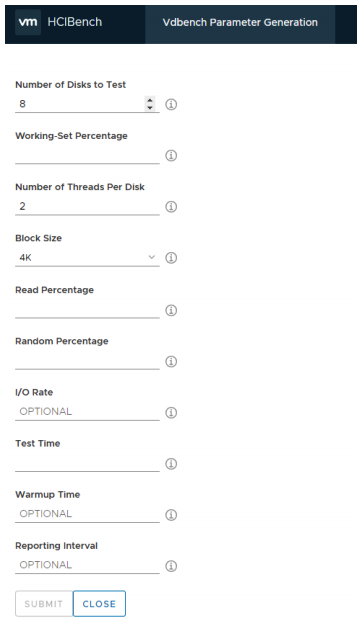
To work with HCIbench, you merely have to set script parameters for the utility so that it can generate a command for VDbench or fio on what actions to perform in a storage cluster. Here’s how you can do that.
- Choose the workload type.
- Scale the number and size of VMs and disks.
Otherwise, to make testing even simpler, you can use Easy Run mode, the option that automatically picks the configuration, depending on vSAN cluster size and ESXi hosts parameters.
It is extremely important to pick a correct Easy Run workload for testing to begin (4 options available, see the picture above). In general, it must correspond to the type of I/O operations of your virtualized environment.
- Set the configuration parameters for VDbench (workload profile for virtual disks).
There are two ways to impose workloads on VM level:
- HCIBench allows working with various VM types (customization based on profile prefix for VM). Each one of them can have a different profile.
- Possibility to upload your own workload profile.
You can find some useful test profiles here.
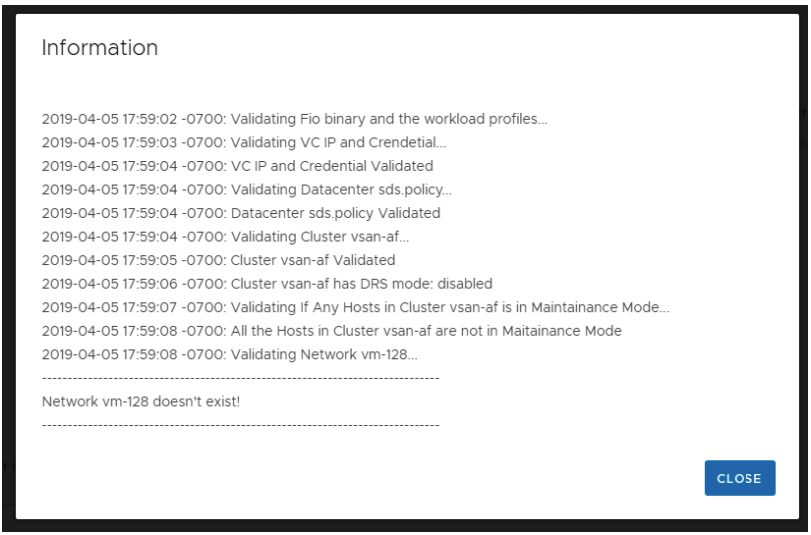
After being downloaded, workload profiles are validated.
After parameters configuration and validation, you can proceed to cluster testing by clicking Start Test. You can monitor the testing process in the dashboard.
After vSAN performed storage performance testing, you can learn the following parameters:
- The maximum number of IOPS
- The latency associated with the number of IOPS required for the workload
- The maximum read/write operation throughput
IOPS, latency, and storage throughput are what the storage performance is all about. Let’s take a closer look at each of these properties.
IOPS
An IOPS number depends on the hardware used for the hosts and network components. It also depends on the RAID level in the vSAN cluster, the number of network connections between the hosts, their workloads, and so on.
A number of threads per disk also determines performance. You can begin testing with several threads per object, then increase the number of threads until the number of IOPS ceases to grow.
A number of IOPS correlates with the latency. Making the block size larger leads to the lower number of IOPS and higher latency.
Latency
Latency is the amount of time an I/O request takes to traverse the system. For applications, it means the time needed until the I/O request is proceeded. Usually, latency is measured in milliseconds. Since there are no reference measurements, you need to fit the latency according to users’ needs.
I/O block size increasing, read/write ratio, simultaneous I/Os from several VMs – all of these factors affect the latency.
Storage throughput
Storage throughput is an essential property when it comes to performing I/O in large blocks. The bigger I/O size is, the higher throughput is, which is kind of obvious. In terms of the amount of transferred data, a single I/O operation of 256K equals 64 I/O operations of 4K. However, in terms of throughput, numbers will be different for transferring a 256K block and 64 of 4K blocks as they take a different amount of time.
How you test with Easy Run
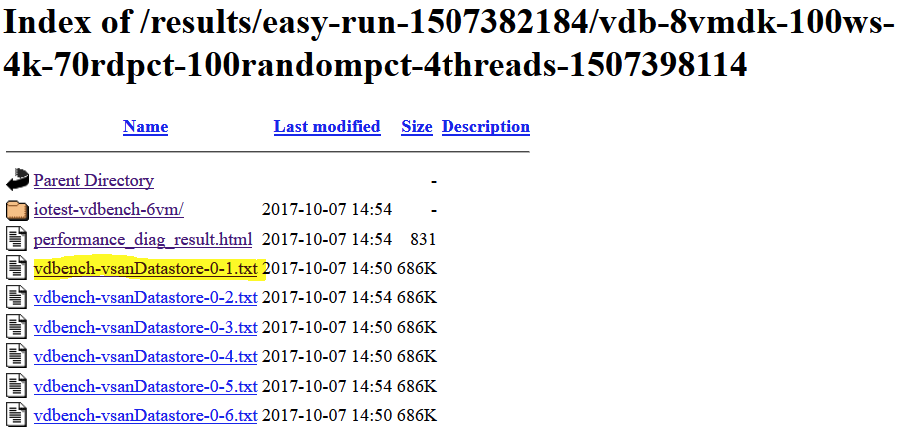
After completing the Easy Run test, you will get an outgoing file that looks like this: vdb-8vmdk-100ws-4k-70rdpct-100randompct-4threads-xxxxxxxxxx-res.txt. File name hints the text configuration used (it will also be in the file itself).
Block size : 4k
Read/Write (%) : 70/30
Random (%) : 100
OIO (per vmdk) : 4
In the folder with test results, there will be a subfolder with separate files with the results of completed tests.
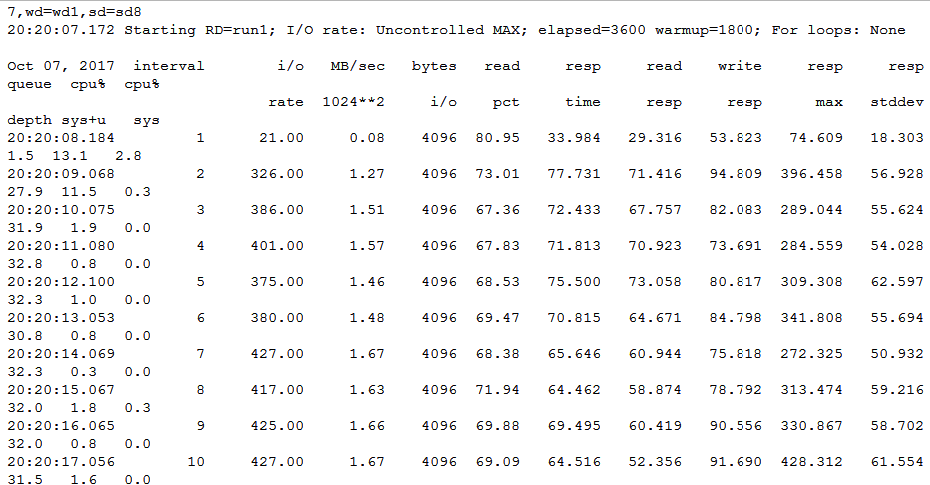
If you open one of these files, you will see vSAN environment parameters.
These parameters are a baseline for testing cluster performance. Now all you have to do is increase the number of Outstanding I/O (OIO) threads. This test will help you to reach optimal performance. A larger parameter value leads to higher IOPS number, but keep in mind that the latency shoots up as well.
Experimenting with I/O operation size is another way to measure the storage throughput. The modern OS’s support operation size between 32K – 1MB, nevertheless 32K – 256K I/O operation size suits better for testing. The perfect option is to find out the workload size and profile common for your particular infrastructure, which you can do with Live Optics or other similar tools.
Conclusion
All in all, HCIBench is a perfect tool for real-time storage cluster performance testing and its prognostication for various workloads. All you have to do is configure workload profiles according to routine tasks.
Things to remember:
- Synthetic testing does not take into account that the real-time cluster workload profile always changes depending on the read/write ratio and data flow randomization. Don’t forget that whatever profile you chose, it is just an approximation.
- Testing is conducted to monitor only storage characteristics, while CPU loads or ESXi Host Memory (however, you should account for them while testing) are not tracked.


