There is a community project I’d like to highlight today. Not sure if every VMware admin knows about, but there is a free Open-Source VMware vSphere monitoring software called SexiGraph that has been recently updated to support the latest VMware vSphere 7 U3, including vSAN and its APIs. It is already the eighth SexiGraf version: 0.99h codename “Highway 17”.
SexiGraph is a community project of two French IT guys Raphael SCHITZ and Frederic Martin. The product has a Grafana frontend which is able to produce very nice dashboards. For VMware vSAN users, this software brings very detailed VSAN statistics similar what you were used to.
SexiGraph is very fast and the creators of the software said that it was the goal during the design phase to make these stats being nice and viewable very fast.
SexiGraph is able to get all sort of stats from your vSphere environment. Whether you want your VM’s stats, datastore’s stats, hosts, clusters, vSAN or vCenter. There are pre-created dashboards pretty much for everything. And if those default dashboards are not enough, you can create your own to fit your needs.
SexiGraph Features
Monitoring – The main interest is obviously detailed and fast monitoring of your infrastructure. SexiGraph does this through dashboards. Diferent metrics are grouped to different dashboard. Metrics such as hba, network, storage, power are for example tightened to Cluster FullStats dashboard.
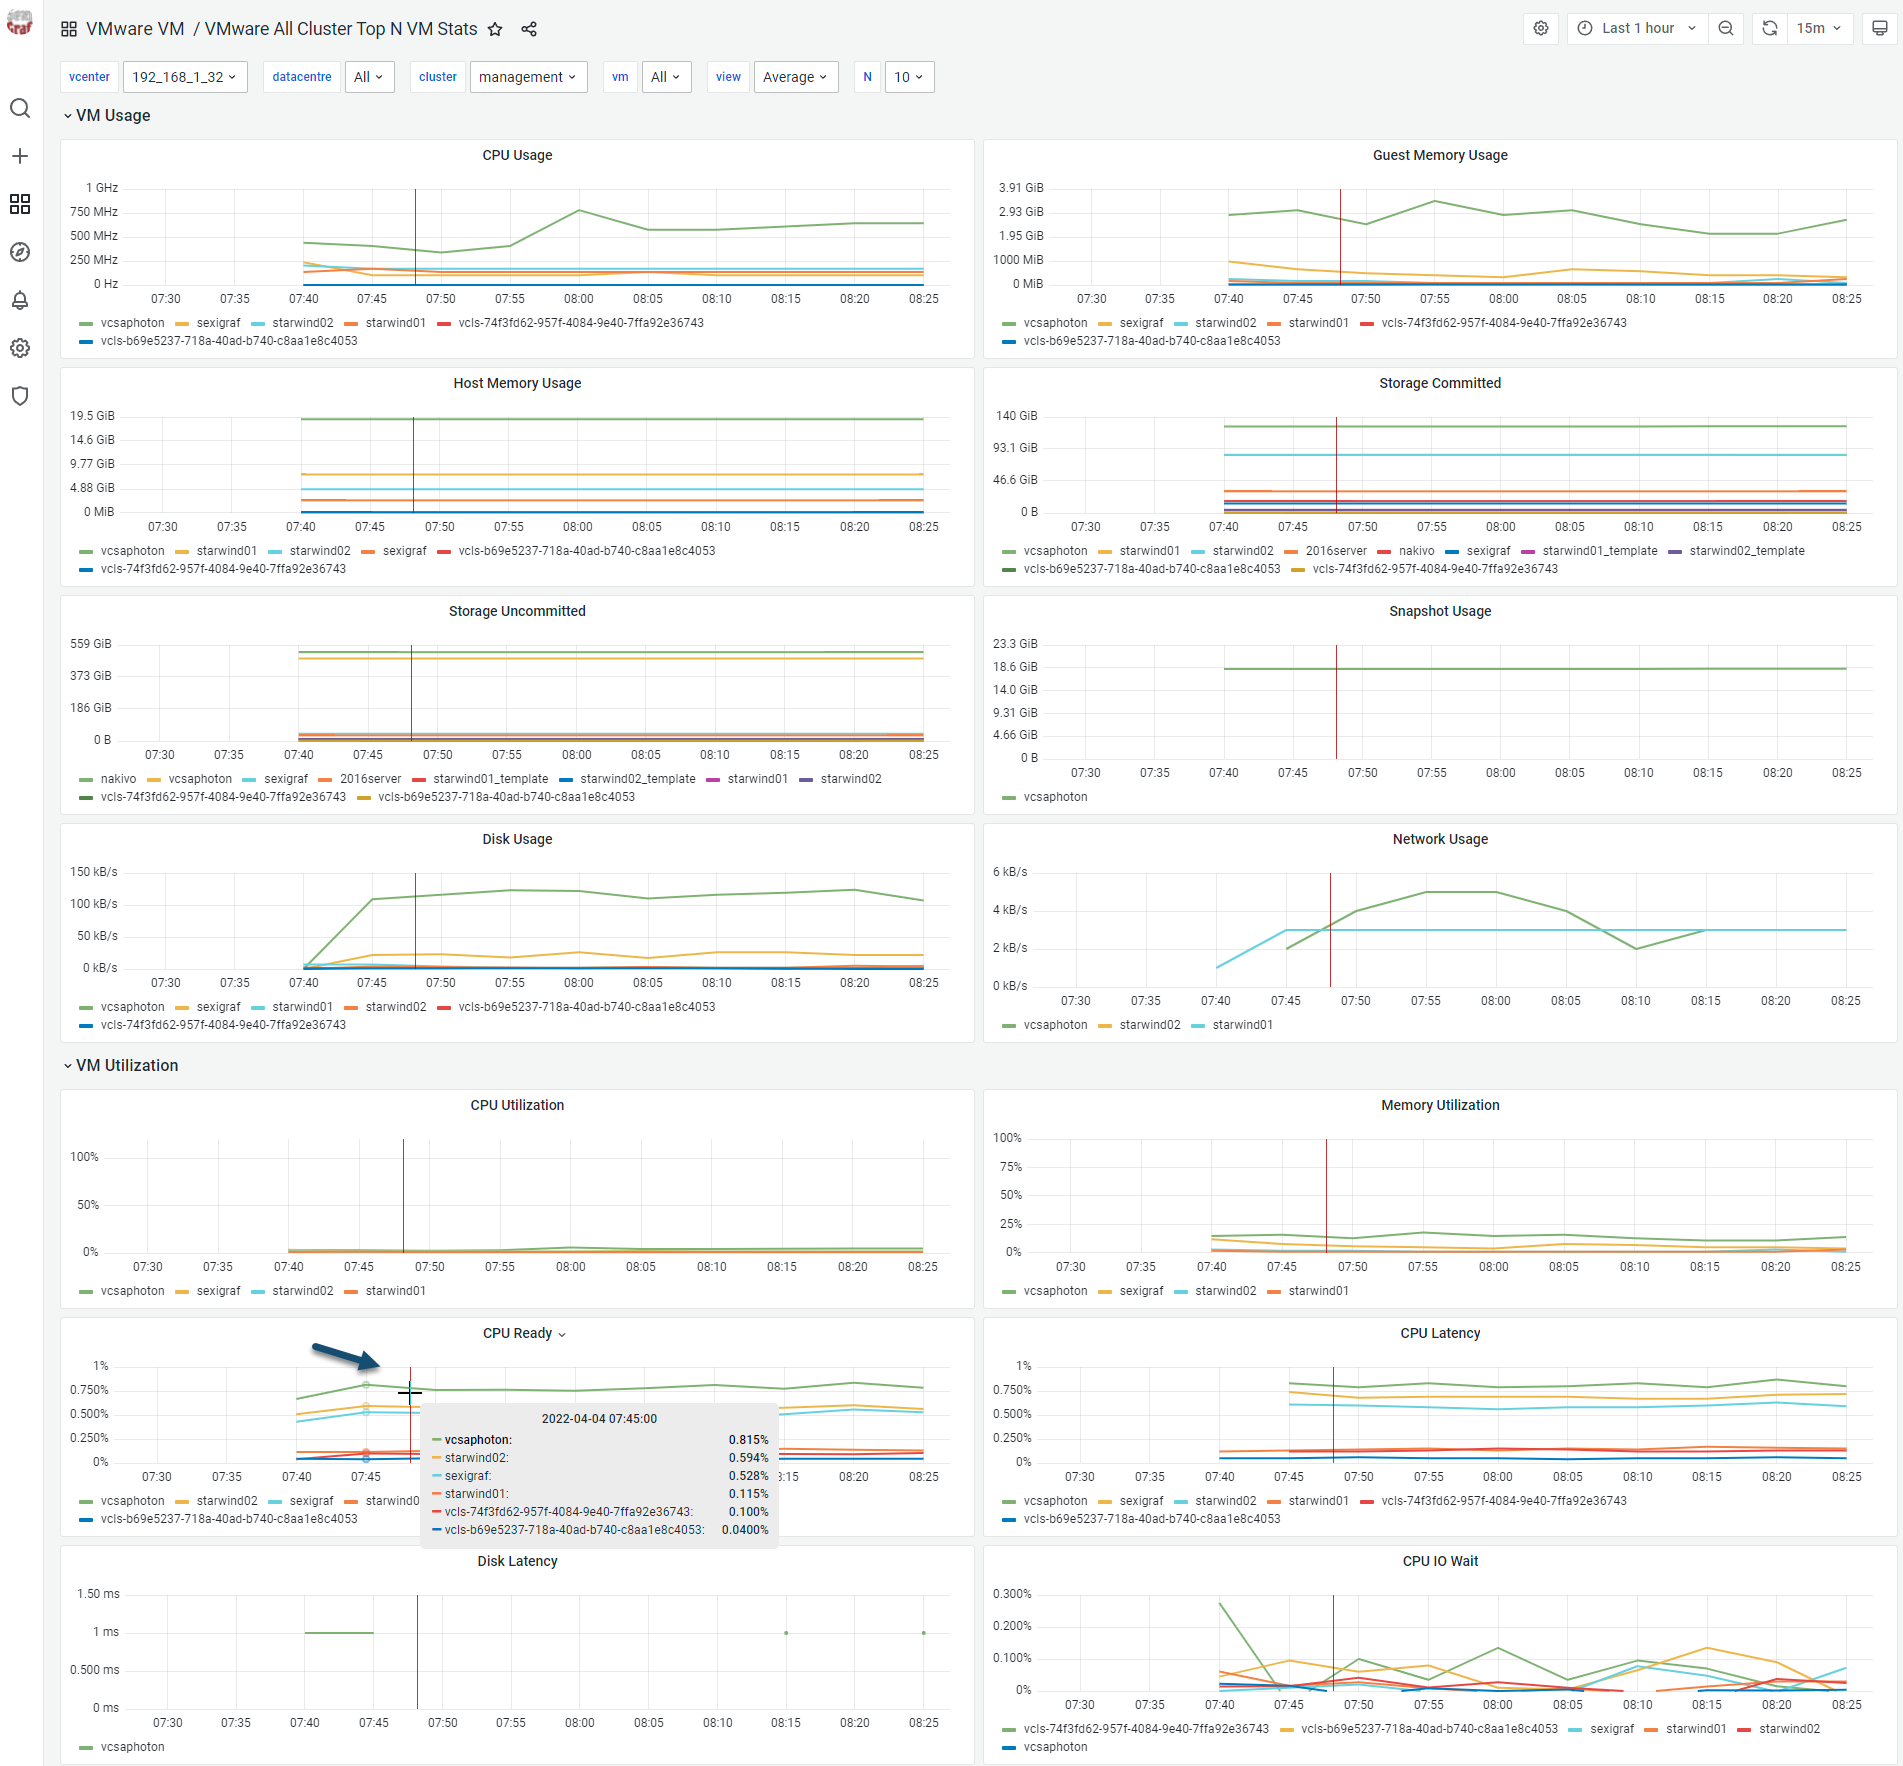
Stats and Logs – you have several dashboards that can help you to keep track of your environments, and stats. You can see for example the see the usage in percentage or mhz/mb and the uptime on the same graph via Cluster Multi ESX LiteStats dashboard. Or you have a stats for your VMs via dashboard called All cluster Top N VM Stats. This dashboard can monitor Top N VM quickstats (1-20 VMs per graph).
Track latency and iops, snapshot usge, CPU or Mem usage in % or the CPU Ready metricks.
Top N VM Stats
SexiGraph Installation and configuration
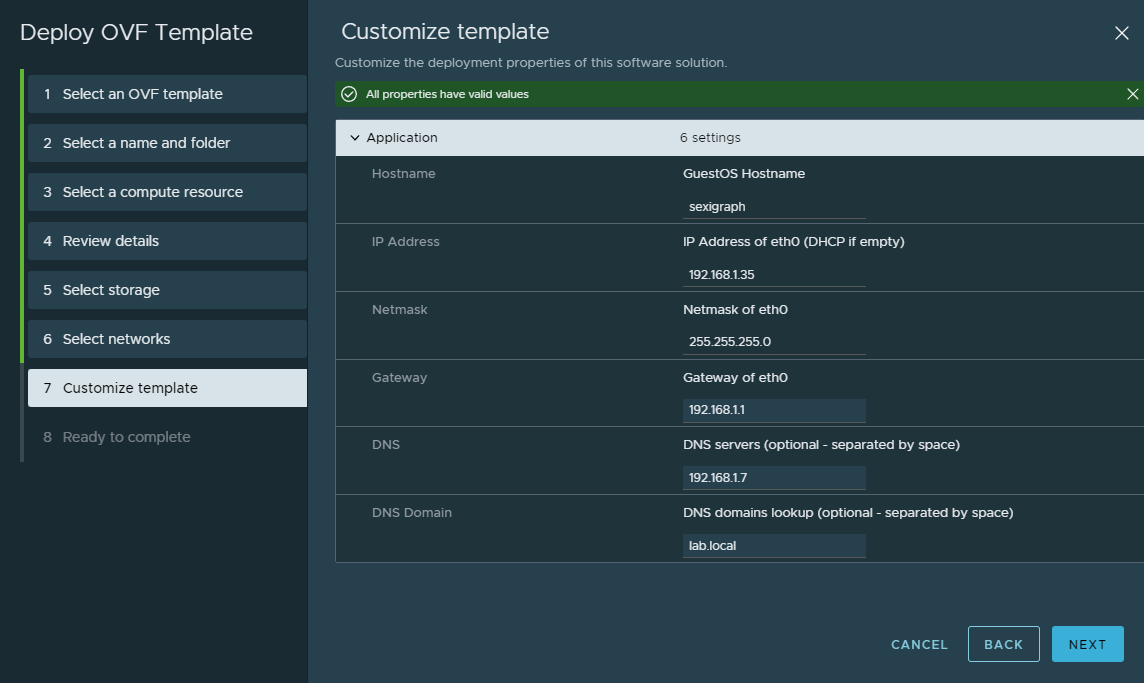
The product is easy to deploy. It’s distributed as an OVF file that you can deploy via vSphere web client onto your infrastructure.
The deployment is really simple. Just follow the assistant guiding you through. Basically, you’ll just be asked about the ESXi host where the appliance will run, datastore, etc.
SexiGraph deployment summary within vSphere client
If you want that SexiGraph pulls data and performance counters from your vCenter and ESXi servers, you will have to add your vCenter/ESXi informations. And also specify credentials.
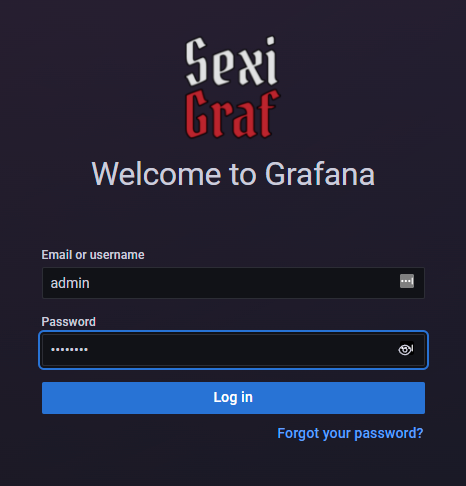
SexiGraph default login password screen
Just connect to your SexiGraf web interface at http://ip_or_fqdn/ and select dashboard called SexiGraf Web Admin
Connection details through web interface (login / pass ):
admin / Sex!Gr@fSexiGraph configuration dashboard
There you’ll click on the Credential Store mini-dashboard. As you can see, there is also other dashboards such as Package Updater, house cleaner or Refresh Inventory allowing you to force a refresh when your inventory has grown or shrink.
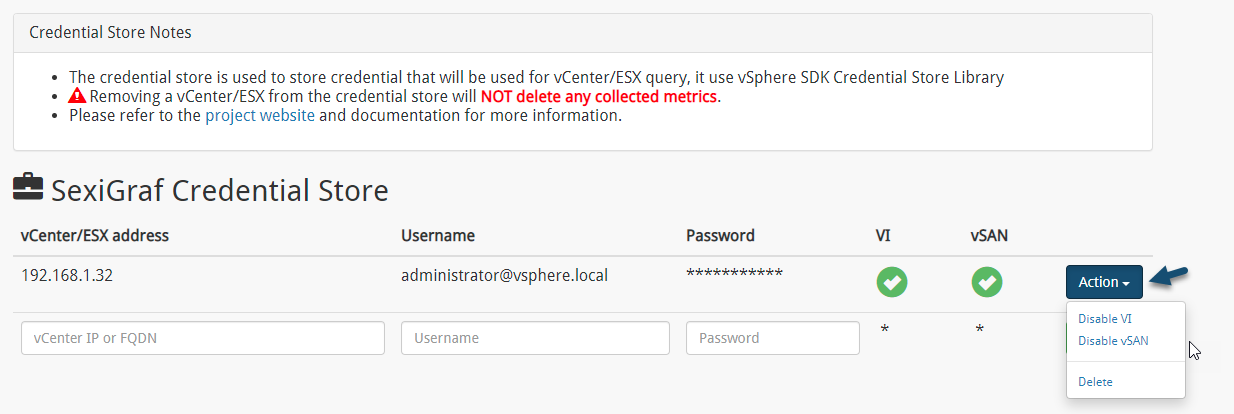
SexiGraph Credential Store to add Credentials
Once there, you can add your vCenter server credentials. Make sure to go to Actions and Activate the VI and VSAN. (You’ll see that there are red crosses that become green check marks after).
If you don’t have vSAN within your environment, it’s not necessary to enable VSAN there.
If you have any ESXi hosts that are not managed by vCenter server you can add them there as well. This is new feature added in the latest version of vSphere. This allows you to monitor ESXi free version too. The dashboards are the same as the standalone hosts but under “_unmanaged_” vcenter and datacentre.
Add your vCenter Server Credentials here and activate the VI and VSAN
Then what you should see is the appliance will start to pulling up some data from your environment and you’ll be able to navigate through the different dashboards and view details.
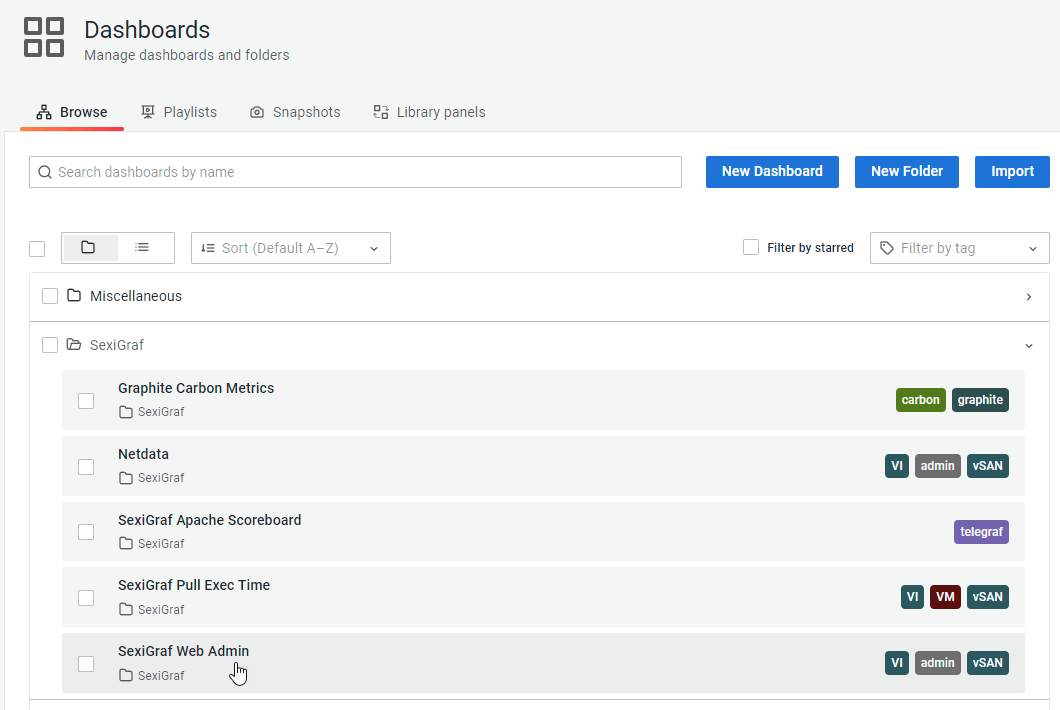
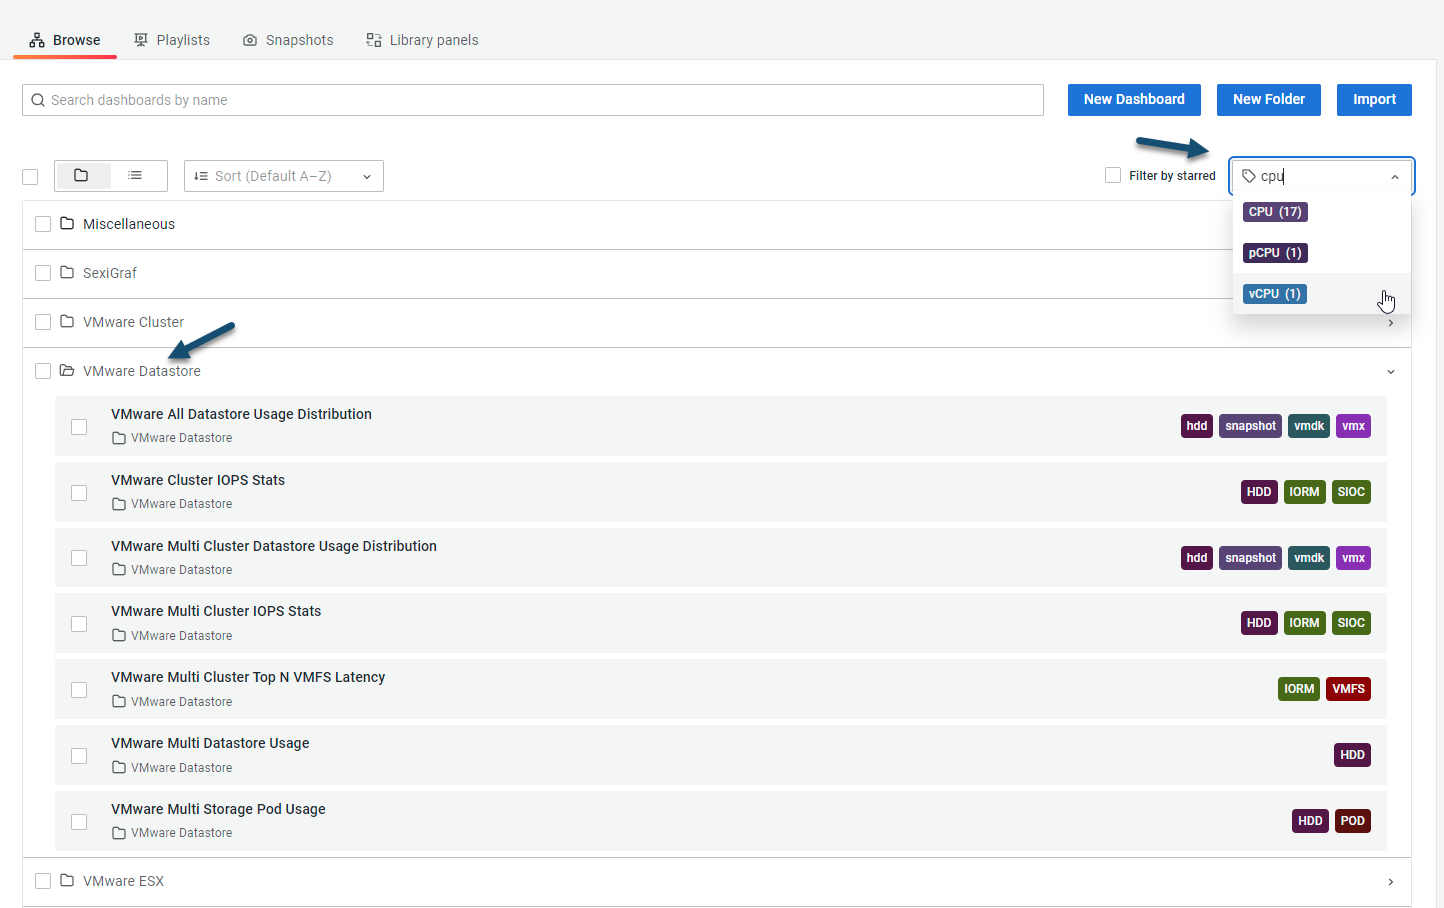
One click opens the folder with the dashboards, and then, you simply click on a dashboard you want to see.
On the right, there are tags (can be filtered by the filter tag search box) that can be very useful when looking for let’s say a dashboards with only CPU informations. When you type first letters the filter lets you chose what metric you wish to explore dashboards with.
SexiGraph Dashboards you can explore
When browsing those dashboards, you’ll be nicely surprised by its speed while navigating. Everything is super-fast.
Add On and Plugins
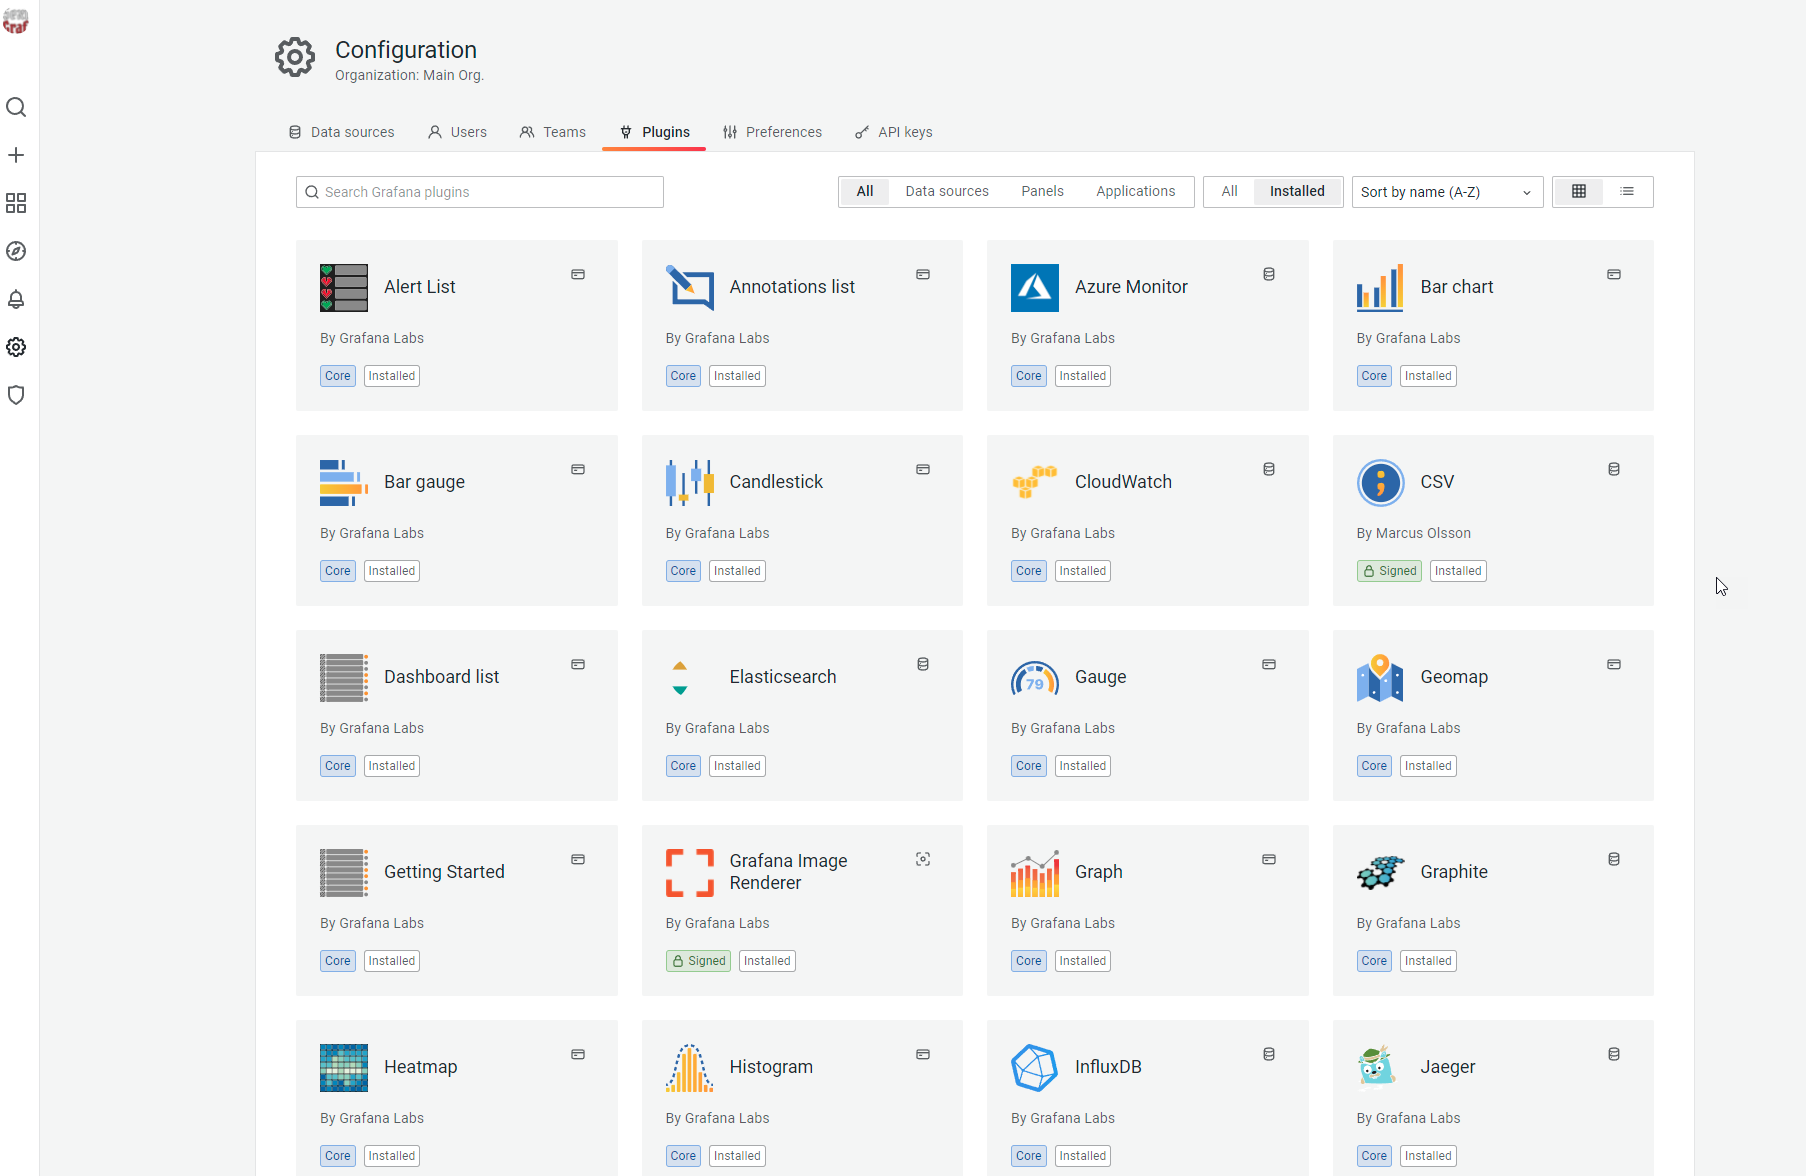
The solution is extensible. If You have a look in the Configuration > Plugins section, you’ll see plugins that are organized as data sources, applications or panels (or All).
Add On and Plugins
Final Words
If you are looking for a fast-monitoring solution for VMware vSphere environments and need to drill-down pretty deep on metrics, you should definitely check out SexiGraph. It’s free software (with enterprise licensing possibility giving you more options) that is very complete, fast and easy to use.
In addition to vSphere, you can also monitor vSAN, FreeNAS, Windows or pfSense firewall that allows you to have pfinfo data that lets you monitor packet filtering service of the firewall.
