For those of you who do not know vRealize Log Insight. It is a log collector and analyzer, with a pretty, simple and intuitive GUI. An easy way of managing logs and messages from all your datacenter devices. Best of all, it is not a VMware only product! In that sense that as long as the message is in syslog format it can be ingest by Log Insight. Wait, that is not all. If the device does not support syslog, like a Windows server. The Log Insight agent you can install on the OS in question. The Log Insight agent can handle Windows event viewer messages and log files of any kind. So even applications that do not adhere to any of the normal ways of logging messages (like syslog or windows event viewer), can still be collected, by specifying the location and format of the log file(s).
Lots of companies collect logs for one reason and one reason only. Compliance. I am not saying you should not do that, but if you only collect logs for the sole purpose of compliance, you are missing some great opportunities. This can be the differences between being proactive or reactive! The secret to how well your datacenter is run is in the logs and therefore Log Insight should be your gold standard for getting answers and preventing outage. There is more in there than meets the eyes.
What is it that makes Log Insight such a great tool? In my book, it is the simplicity and the insight.
The simplicity in the sense that it is a very simple GUI and UX. Only two tabs. Dashboard and Interactive analytics. More important is extract fields. It is one of the core way you interact with Log Insight. The main pillar for creating context and dashboards. Without it, Log Insight would not be what it is. It is the simple idea of creating context in the messages that have been ingested by Log Insight. It is based on the use of regular expressions for creating a pre and post context to the field or data you want to extract. By extract I mean, make the field or data easily searchable or even better create filters based on the extracted fields and the value a given extract field holds.
The way you get started and extract a field, is simply by highlighting the data you want to have extracted. Log Insight then tries to create the regular expressions as best as it can for you. All you have to do is validate Log Insight has done a good job or correct it however you see fit.
In the screenshot three filters can be seen, the first field is a default field that comes with the default vSphere content pack. The last two is fields I have created simply by highlighting the text and giving it a name. It might not be obvious what these filters do, so I will explain them, to give you an idea of what can be achieved. The match rule for filters, is set to show data if ANY of the filters are true. Two of the filters only checks if the extract field exists. In the context here I am creating an audit trail of who has been logged in to an ESXi host via SSH and what they have done. This brings be to the last field. Appname. The appname filter uses a statement to validate if the extract field contains a certain value. In this case, the filter checks to see if the appname contains shell. The reason for this is that by getting any messages from shell, we can track what the user did and at what point in time. Very easy to setup and very powerful when audit trail is necessary. This could also be used to alert whenever a failed login attempt is tried against an ESXi host or whenever someone logs in as root instead of using AD credentials. If you want to read more about the use case I did a short blog post about it some time ago over at my blog. It is called vSphere audit trail with Log Insight and can be found here.
The extract fields and search methods can be saved as the widgets on a dashboard, which can be exported as a content packs. There in lays the sole power of Log Insight, the ability to share these structures across Log Insight installations. VMware has even build in a marketplace where content pack can be downloaded free of charge. This gives you instant access to knowledge about how a given system should be monitored, be it a Cisco ASA firewall, an Apache webserver or one of VMware’s own products such as vRA or NSX. Getting insight is at your fingertips.
What kind of insight can you then get? Well, that sort of depends on what the question is.
- Do you want to know why your snapshot based backup is failing to take snapshots – Log Insight got the insight
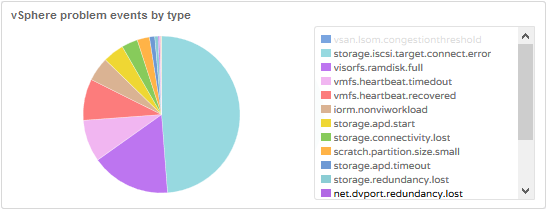
- Do you want to know if there are any ESXi related problems (see the pie chart) – Log Insight got the insight
- Do you suspect there is a storage related issue – again Log Insight got you covered, with SCSI sense codes and errors
- Want to see CPU or Memory failures before your hardware vendor declares the component is failing – You guessed it, Log Insight is the place to be
When you see that light, there is nothing Log Insight cannot give you answers to, because changes are that it is in the logs. The second best part of all of this is if you are using VMware products changes are that you have Log Insight for free included in your licenses somehow. For more details on licensing see here.
I hope this gave you a glimpse of what VMware’s vRealize Log Insight has to offer, you and your datacenter.


